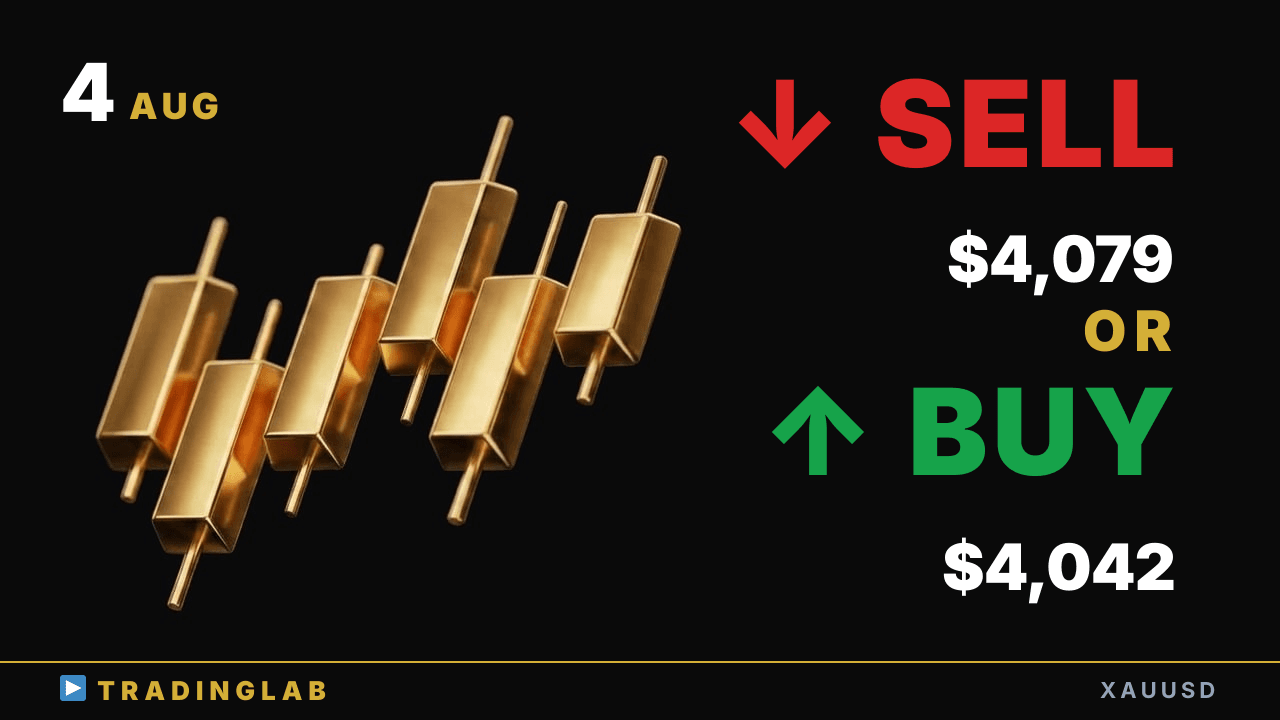
Gold is pinned near the top of the Tokyo range and Daniel is leaning short into the break. Watch 4,079/4,069 resistance vs 4,042/4,019 support — whichever side goes first sets the next leg. Inside this: how to trade the range and exactly when to flip your bias on the breakout.
Gold coiling near range top — break 4,079 or drop to 4,042? | XAUUSD Aug 4
 Watch on YouTube ↗
Key levels in this analysis
| Resistance | 4,079 · 4,069 |
|---|---|
| Support | 4,042 · 4,019 |
Summary
Video transcript
Hi, I'm Daniel, a working prop trader, and today I'm leaning bearish on gold. On the 1H, the Tokyo session is stuck in a range, and price is now hovering near the top of that range, so for now I'm prioritizing short setups here. Still, direction here gets decided by whichever way this range finally breaks.
Last time, exactly as I told the community, price broke below the Tokyo session low, put in a pullback move, and then dropped straight down for a full 432 pips from there. The key focus right now is which way price breaks out of this range. Today I walked you through how to trade inside the range and exactly when to flip your bias after a breakout.
Alright, let's get right into it and start with the daily chart. On the daily chart, gold closed the prior session as a bearish doji candle. Once again price is trading inside that bullish doji candle, so the market has no clear direction and momentum stays unclear right now.
What's clearly defined here, though, are those key levels. As for that key level, it's the daily-chart point where longs likely got triggered, and I've been watching it closely for a while now. And yesterday too, we again saw buyers stepping in and defending that very same level.
So if a big move is coming, then the moment price breaks below this key level, the bulls will all rush to trigger their stop loss orders at once, one after another. Around this zone, if price breaks out to the downside, you really need to factor in that the momentum tends to accelerate sharply right afterward. On the flip side, most of the candles still overlap each other, and price remains contained inside that bullish doji candle, so we're still stuck within that same range for now.
Taking all of this into account, the daily chart still isn't giving us any clear directional bias just yet. And just for reference, the short-term plan itself keys off those buy-support zones I just mentioned, plus the four key prices on the prior candle — the open, the high, the low, and the close. These points tend to draw attention as the upper and lower bounds of the range, so it's worth keeping that in mind and positioning your trades around them.
Now let's move down the timeframes to the 1H chart. On the 1H chart, my community-only stream from the previous day went out right here at the red line, where this bearish doji candle formed. Here on YouTube, I'd like to walk you through exactly what I was explaining to my members at that moment, going through it step by step along a few key points.
So the first point is how the Tokyo session moved during the prior day. As for the Tokyo session, it was clearly a complete trading range. It marked the high right at the open, then set the low around the second hour, and after that just drifted inside that band — a textbook trading range day.
That said, last Friday we got a really strong buy setup, so keeping that backdrop in mind, basically the Tokyo session low — right around this area here, I believe — was the key level I was watching closely. Right around here — I said that until price breaks below this level to the downside, my bias stays to the upside. And if price breaks below this Tokyo session low to the downside, we drop into that nearby key level — the very bullish long entry point we spotted earlier on the daily chart.
We were expecting buyers to step in and defend that key level, and I said that if the breakout failed, price would form a double bottom and flip us back to a bullish, upside bias. This is how it played out, but let's walk through the price action that led me to that call. The first thing I focused on was this reversal low we made late last week, right at the New York session close — a really strong setup.
Coming off this strong setup, there's a solid chance we flip into an uptrend from here, but if it's really going to switch into a genuine uptrend, keep in mind the downside momentum up to this point was extremely powerful. Looking at each thrust leg, the bodies are decent-sized bearish candles, and the pullbacks weren't price-based corrections but time-based ones, so this is a market where you can clearly confirm the bulls just weren't stepping in aggressively at all.
Even factoring in the whole price action leading up to this reversal low, I felt we still needed a clear higher-high move, or at least another test of that same level, before committing. So that oversized reversal low on its own just wasn't enough justification to go long, and I explained that the plan was to hold off and wait patiently for one more clear bullish signal before actually entering. As it turned out, the second entry point formed right here at the Tokyo session low, where we confirmed another reversal low, but the follow-through upward never came cleanly, so I think this one ended up as a stop loss.
By flagging these key points ahead of time and then following the price action closely afterward, you can see that this sideways range here had a very high probability of forming, and that's exactly the kind of setup I'm walking you through in this breakdown. Yesterday's breakdown focused on the price action from the Tokyo session open and the structure that followed. When you get a high formed at the open and then a strong pullback, you usually see either a trading range or a strong trend developing from that open.
As for yesterday, the move that kept pushing the lows lower ended completely right at that same point, so with just these two candles, the Tokyo session price action was really shaping up to become a classic trading-range day. With all that context in mind, the real focus here is how price behaves once the London session kicks in. The key trigger there was the Tokyo session low.
Whether or not price broke through that level was going to be the starting point that made the next direction clear. So how did the market actually play out? Price ended up breaking below the Tokyo session low, and after that we got a pullback move that turned into a reversal high, which capped right at the top of that Ichimoku zone.
After that pullback, gold dropped from the high down to the low across a full 43-dollar range, which works out to a 432-pip move to the downside. So this played out right in line with our scenario, but what really matters is what comes next. It tested that same level twice, forming a double bottom, then reversed and connected right into this current uptrend.
The Tokyo session is of course sitting in a trading range right now, but the whole move leading into that range was a clean, textbook uptrend, so this played out exactly as our scenario called for. So today, in the community-only session, I walk you through three key points that shape exactly how we play the moves coming up next. I break down how to trade the upper and lower bounds of a trading range, how to spot failed breakouts, how to read the direction out of a sideways range, and how to catch the shift into a range early by tracking fading momentum on the chart.
On the daily chart, gold has been stuck in a range for a long time now. In a range like this, if you don't stay disciplined about how you trade it, even setups that look great end up stacking losses and dragging your balance into the red. So it's really worth locking down exactly how you handle this kind of range market. That wraps up today's gold analysis.