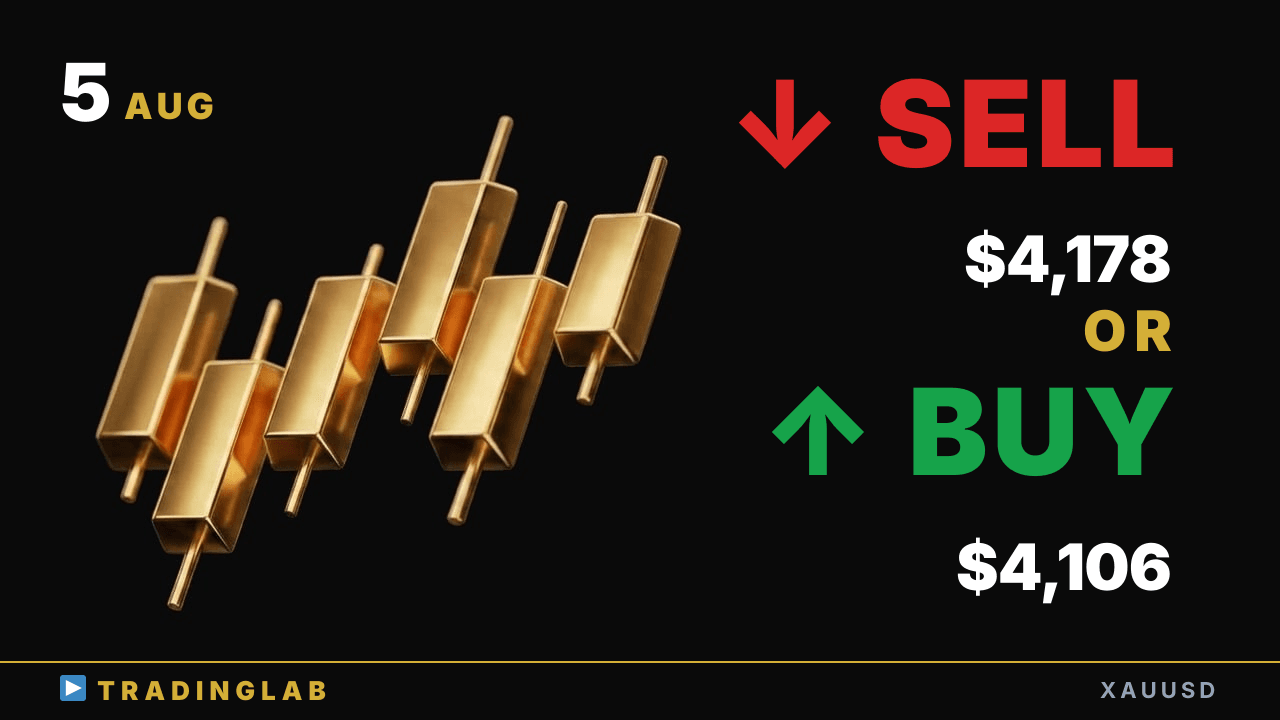
Gold holds a strong 1H uptrend into the daily breakout test — the question is whether today's candle closes clean above resistance at 4,178 or slips back toward 4,106. Daniel maps the exact pullback-buy zones, the 4,070 line that breaks the bullish case, and where to watch next.
Gold at $4,178 — breakout run or pullback to $4,106? | XAUUSD Aug 5 plan
 Watch on YouTube ↗
Key levels in this analysis
| Resistance | 4,178 |
|---|---|
| Support | 4,106 · 4,070 |
Summary
Video transcript
Hey, this is Daniel, an active prop trader. My bias on gold today is bullish. On the 1H chart, momentum is strong and the uptrend is still intact, so the key focus now is whether price can break out above the high set during the Tokyo session.
Just like the scenario I shared with the community last time, price broke out above that sideways range I was tracking as the key level, and after a clean pullback it shifted right back into a solid uptrend, exactly as we expected it to play out. Counting up from the low of that pullback candle inside the sideways range, price has now climbed roughly 1,086 pips higher. We're still in the middle of a strong uptrend, so even if a short-term correction sets in from here, I'd expect price to turn around and take another run at the highs.
Today I laid out exactly where to look for pullback buys and what would break the bullish scenario. Let's dive right into the daily chart. On gold's daily, yesterday's candle closed as a bullish candle with a long upper wick sitting right above the body.
Looking back at the daily range so far, volatility has clearly been contracting, and that's the kind of setup we typically see right before a breakout unfolds. If today's daily candle closes with a clean break above yesterday's daily high, I'd expect price to lean upward in the short term, and that's the moment where the directional bias really firms up and gives us a clearer scenario to work with. On the flip side, if price falls back inside this range instead, then I'd expect a move that at least tries to test the low of this candle here, so keep that in mind as the alternative scenario.
One key thing today is where the daily candle actually closes, since that body-close level really matters here. Now let's shift the timeframe down and take a look at the 1H chart. Yesterday's community-only stream went out right around this red line here, where that bullish candle was forming.
So what I want to do now is walk you through exactly what I was explaining to members at that moment, and carry that same analysis forward right here on YouTube. So first off, I was reading the Tokyo session as a trading-range day, and using these two candles right here as our reference candles, I saw a sideways range starting to form off of them, holding flat inside that zone. I laid out two scenarios: one where we trade the range from the inside, and one where a trend kicks off in whichever direction we break out.
Naturally, since we're trading inside the range, we should look to short at the top of the range and look to buy long down at the lower boundary. And if a trend develops in the direction of the breakout, my plan was to buy the pullbacks along with that trend, following the momentum. Next, I also walked through the whole thought process that led me to this call, breaking it down step by step for our community as I always do.
I want to walk through each candle I was watching, and the first one that really caught my eye is this doji formed around the fourth 4H candle right at the open. Once this perfectly formed doji printed, I started reading the market structure by watching for a sideways range, a possible measured move, and especially any failed breakout that might follow off that level. Basically, at that point I was expecting a trading range to develop from here, price chopping sideways rather than trending cleanly.
And in the end the range broke lower, unfolding exactly that way. Next, the candle I'd been watching was a reversal high that also formed an outside bar. The one I mean is right this candle here.
This candle here is the big bearish one that formed when price touched the range top of that earlier doji. That prior candle was actually the doji formed when price tested the range's lower bound. Price closed below that doji, so after a candle like this it tends to sweep the stop losses of the bulls who bought in here.
At minimum, a doji-sized measured move is fairly easy to produce here. Looking back, if you take that doji-sized range width and apply it to the range's lower edge, You can clearly see a clean measured move forming right where it overlaps with the body of this bearish candle. It's worth pulling up the chart yourself and checking this against it.
The next candle I was watching closely is right here on the chart. After the price broke below this doji, and then broke back above the most recent doji candle right here. I confirmed the upward momentum was gradually fading step by step here.
Once this doji formed, I judged the market would easily lose its clear direction. If you simply track how the size of each bullish candle's body changes over time, you'll see the bullish bodies gradually shrink in size. As an early warning before a corrective phase, these shrinking bodies tend to show up first.
When direction is strong, you see the opposite pattern. For example, look at the upswing that formed right from the Tokyo session open. The bullish candle bodies keep growing in size here.
This is how direction gets clearer. One clear way to read the price action here is this. You might want to watch how the size of the candle bodies shifts.
And in the end, once the upward momentum faded, price started forming a sideways range here. Forming an inverted triangle here. A sideways range based on these two candles as anchors.
The Tokyo session closed in a clean trading range day. Eventually price kept getting sold off at this upper edge, trading the range. Starting with the doji breakout here, price then broke out of the range to the upside.
As the scenario goes, a trend tends to emerge in the direction of the range breakout. As I mentioned, right after price broke out above this sideways range here, the Tokyo session open showed a really classic pattern. Price pulled back to the top of the sideways range, then pushed higher from there.
forming what looks like a double-bottom pullback here Counting up from the top of this sideways pullback range, up to the recent high we've confirmed a rally of roughly 1086 pips in dollar-pip terms. After a while, we finally got a clean upswing with a clear, decisive sense of direction. Today, in the community session, I broke down our scenarios and how to play them across three key points.
How to think about buying pullbacks in a strong uptrend, and reading price action that values the process over any single reversal candle. A key entry point to watch as the session shifts over. Today I walked you through my analysis, including the core ideas at the heart of my whole trading strategy. The uptrend structure still holds, so gold stays bullish today. That wraps up today's analysis.