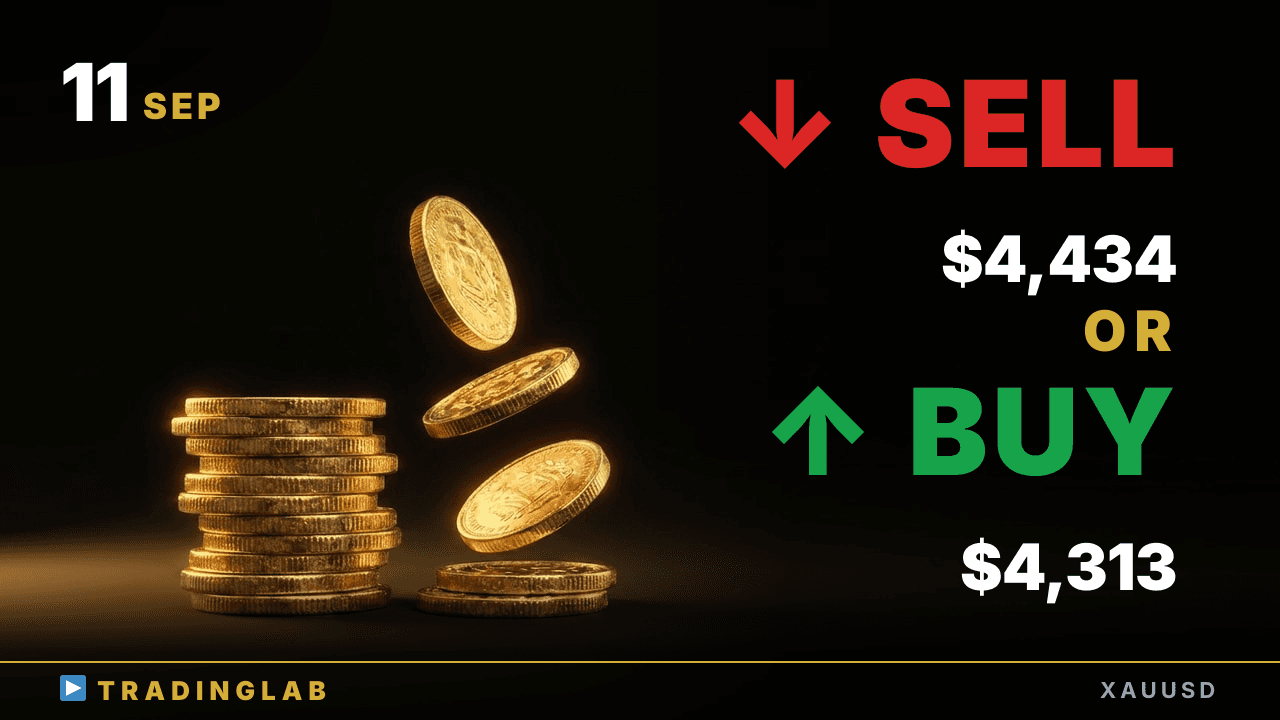
Gold flipped into a 1H uptrend but is now consolidating inside a small range — the next breakout decides the move. Daily is stuck between 4,313 support and 4,434 resistance, with 4,300 and 4,360 as the pivots in between. I walk through the daily indecision, the outside-bar range on 1H, and the breakout-and-pullback plan for both sides.
Gold in range 4,313–4,434 — which side breaks first? | XAUUSD Sep 11
 Watch on YouTube ↗
Key levels in this analysis
| Resistance | 4,434 · 4,360 |
|---|---|
| Support | 4,313 · 4,300 |
Summary
Video transcript
Hey, this is Daniel, active prop trader. Gold today is leaning slightly bullish. Since last time it played out just as planned, reversing off the range top and then breaking down below the range.
The downtrend kept going. From the high of the candle right after we published, down to the recent low, it dropped exactly 1246 pips, playing out just as our scenario called for. Right now price has broken above the recent 1H high and flipped into an uptrend, but that first upward swing is now carving out a small range, so we're consolidating here.
So the key here is which way the next breakout goes: whether price breaks the range upward and the rally keeps running, or whether the breakout instead pushes downward from here and price swings back into a downtrend — that's the key focus I wanted to walk you through today. So let's dive right in and go through the daily chart in detail first. On gold, the previous daily candle closed as a big bearish candle.
That's yesterday's candle, and as of yesterday, this was the scenario I was laying out for you on the daily chart. First, because this closed here as a doji on the daily, I think the downside breakout from this small doji, and the follow-through move that came off it, has now been invalidated. So basically, given this doji from the previous day, a sideways range tends to form here.
And going a bit further back, this bearish doji candle was still in play as a level traders were watching, so I explained there's a strong chance price comes back up to test this high again. On the other hand, if price briefly pokes above the high of this bullish doji candle and then reverses and starts dropping back down, in that case, at the low of this bullish candle here, when that breakout level gives way, it can trigger the stop loss orders sitting under the long positions, wiping out the bulls, and that cascade of stops makes a sharp move lower much more likely.
In fact, yesterday's candle tried to push above the prior high, then reversed and closed below the previous day's low, so structurally the bias here is leaning to the downside for now. The break to the recent low was shallow, the upside breakout barely covered any distance, and since price hasn't accelerated at all afterward here, taking all that into account, I think we need to revise our read on the daily chart for now. Specifically, using this bullish candle and this bullish candle as the two anchor candles, we should really treat this as a larger sideways range building out across that whole zone.
So near the lower boundary of that range we get a long bias, while up near the upper boundary a selling bias tends to kick in instead. And along the way, individual candlestick patterns tend not to work all that reliably here. What this really comes down to is that the daily chart still hasn't settled on a clear direction yet, so its overall bias remains pretty ambiguous for now.
Given that the daily chart lacks any clear direction right now, we really need to build our strategy on shorter timeframes instead, so let's move straight into the 1H chart. This red line marks where the 1H candle had closed the previous day, right when I streamed the community-only session. In that community-only session, I walked through two possible scenarios for gold, a bullish case and a bearish case, covering each one in detail.
The main scenario here is this outside bar. Since price is trading inside that outside bar and sitting close to its upper edge, the first read from here is clearly a bearish, downside-leaning bias. As I explained, price should at minimum test the lower edge of this range, and once we get a clean breakout, it tends to run roughly the full height of the range.
As for where I'd flip my bias, that would be if price instead breaks out above the range. But rather than jumping in on the breakout candle itself, I'd wait for a swing to form after the break, then buy the pullback into it. So the plan I laid out was to wait for the breakout and pullback before considering any long entry.
Now, why did I arrive at this particular scenario? I actually walk through the whole price-action process in detail inside our community. Today's Friday, yesterday was Thursday, so let's trace how price moved out of the scenario I mapped back on Wednesday.
I explained that the breakout direction of this small doji candle is what really matters here. If price breaks above this doji candle, we get a higher high off the recent top, which flips us into an uptrend. I explained we'd flip our bias and start hunting for long entries, and now that price has actually broken above this doji candle, we've printed a higher high.
We shift into an uptrend reversal here, then a sell setup forms and price drops back, but as I mentioned earlier, our overall bias stays firmly to the upside. At that entry point, the situation actually called for a long rather than a short, and this bullish candle became the pullback leg, after which price pushes up again, sets a higher high, and forms an upswing. Now look closely at this candlestick, two bars after that upswing formed, because right here we get a large outside bar that completely engulfs the entire previous day's London session price action, and it's also a doji.
Even a single doji effectively marks out a range, and price tends to break in the direction of that range. So as long as the range holds, this becomes one signal telling you to consider trading inside the range boundaries. That's why, since this internal price action isn't sitting at any particularly important level, I don't put much weight on the signal itself here.
Even so, there's one point worth watching closely. Since price tested the top of the range and the breakout failed there, my basic plan is to go short right below the low of that failed breakout candle, and that's where I'd look to enter. With that price action, price basically tested the range low and, once it broke out, played out exactly by the book.
I explained that this doji becomes the measured move, so it's useful for calculating how far the next leg is likely to travel. This should look familiar to our community members, but let's see how the market actually moved afterward. On the 1H chart, price reversed right from the range high, came down to test the range low, and then broke out cleanly below it.
We got a pullback followed by a strong drop, exactly as the scenario laid out. If you count from the high of this candle right after the broadcast, price fell roughly a 124-dollar range, which works out to about 1246 pips of downside confirmed on this move. In today's community-only breakdown, I walked members through how the market plays out from here, covering both the bullish scenario and the bearish scenario in detail.
There are three key points. First, we're inside a range, so short-term the breakout direction is what matters most. Second, the 1H flipped to an uptrend, so right now the bias is slightly bullish, only slightly.
Third point, direction is hard to read here, so wait for a break out of the range before deciding. Based on those three points, I walked you through both the bullish and bearish scenarios. Now back to the real-time chart, price has been stuck in this range since the London session open, and it's just kept drifting sideways inside those boundaries.
Just as I mentioned earlier, the market really is struggling to find any clear direction here. That wraps up today's gold analysis for you.