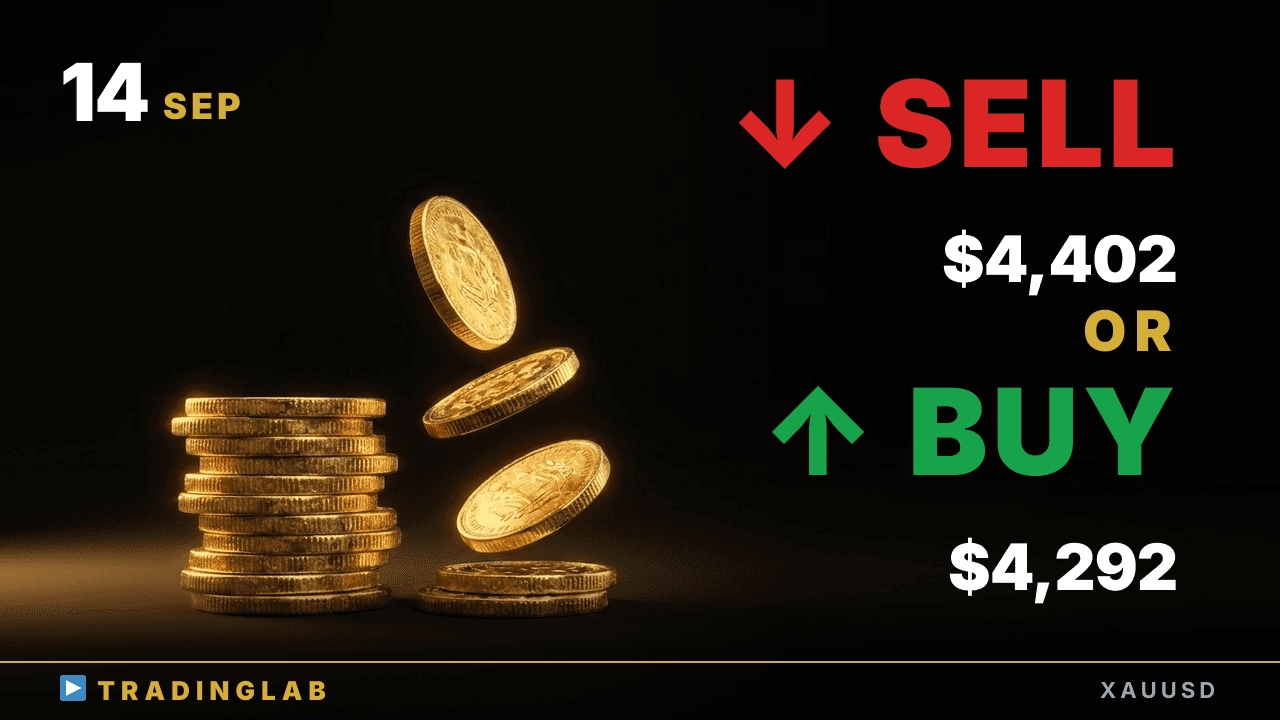
Gold is pressing the lower edge of the daily range near 4,292 after a 488-pip drop and a failed New York reversal. Daniel breaks down why he's not chasing fresh shorts here and where he's hunting longs instead. Key upside references: 4,355 body high and 4,402 range top. Watch for the reversal trigger that confirms this downswing is done.
Gold at 4,292 range low — bounce to 4,355 or breakdown? | XAUUSD Sep 14
 Watch on YouTube ↗
Key levels in this analysis
| Resistance | 4,402 · 4,355 |
|---|---|
| Support | 4,292 |
Summary
Video transcript
Hi everyone, Daniel here, active prop trader. Short term, gold looks bearish today. Since last time, the range I was watching broke to the downside, and we then saw price drop a solid 488 pips from there.
After that, right from the New York session open price reversed, printed higher highs, and pushed up through the top of the range, breaking it to the upside. Today we've swung back into a downward move again, but with the daily range now overshot and looking close to a climax, rather than opening fresh shorts, this is a spot where I'd rather hunt for longs after a reversal. Whether this downward swing keeps running, or price reverses off the lower edge of that daily range and turns up instead — that's the key focus of today's breakdown.
Alright, let's dive straight into the daily chart. Last week's daily candle closed as a bullish doji, right at the same open and close. The daily scenario I originally laid out was that these two candles here would act as our base candles, making a sideways range likely to form, and when you look at the whole sequence of swings we've had up to this point here as well.
We had that doji, and since there was no real breakout or follow-through afterward, I mentioned the market had no clear directional bias here. Just as I said at the start, Friday's daily candle closed as a bullish doji last week, so this really confirms that the market ended with no clear directional bias at all. Now, thinking about what to expect next on the daily chart, the first scenario we really have to keep in mind is a sideways trading range building off these two candles as our reference.
Right now, price is coming right up against the lower boundary of this range, and short term, it looks like we could get a bounce here. If we do get that bounce, there's a strong chance price comes back up to test the high of this bullish candle's body, so I'd say it's quite likely we see that retest play out here. Also, last Friday's daily candle closed as a doji, so those four price points can easily act as a key level and work as reference going forward here.
For today too, once the whole day plays out, there's a good chance the overall structure turns into a trading range again. So keeping all of that in mind, I think this is a situation where we should focus on shorter timeframes, day-trading style or even tighter than that. So let's drop down and look at the 1H chart now.
Our last community-only stream went out right here, around this red line, where that bearish candle formed. Here on YouTube, I'd like to walk you through exactly what scenario and interpretation I was laying out for our community members at that point in time. First, let's talk about my bias.
As of the previous stream, these two candles here had already closed, so I explained they'd act as reference candles and a sideways range would likely form afterward. On the bias again, since we're clearly inside the range, near the lower boundary we'll be hunting counter-trend longs, and near the upper boundary counter-trend shorts. I explained that we set our overall bias in the direction of this breakout, so that's the framework we're working with.
I also walked back through the full process behind this call and revisited how those key levels expanded. Let me extend this a bit, but the real focus here is first that massive oversized outside bar. 1, 2, 3, 4, 5, 6, 7, 8, 9 — this outside bar engulfs at least nine hours of price action, formed by a huge oversized bearish candle sitting as a doji-style outside bar.
This zone has been acting as a range for quite a while now, and if you trace the price action back to where we were at the last stream, price broke out of that big range to the downside, then we got a breakout pullback, another downswing formed, price rebounded, made a higher high, and flipped into an uptrend. So conditions were leaning toward an upside breakout, but if we just read the wave structure here on its own, you could also read it as a short-term uptrend that's simply setting up a clean, easy-to-trade pullback here.
So I was saying direction here is genuinely hard to read right now. On top of that it was the weekend, so it really wasn't a setup where you'd want to aggressively carry positions over — that's what I was explaining. So with all that in mind, let's look at exactly how gold ended up closing out the week.
Late last week, price first broke below this range, and we even saw a candle that looked like a pullback. We got that break to the downside, but the very same candle flipped into a bullish reversal and broke back above the range top. Then it printed a bearish reversal and pushed back again, so the direction was genuinely tough to read here.
With the pullback after the breakout, shorting here was clearly an option too. On the 1H alone the move was quite sharp, so realistically it wasn't practical to plan an actual entry off that single candle — it just moved too fast to time it well. Also, today's community-exclusive content will focus on exactly how price plays out from here.
As I mentioned briefly earlier, I'll break down both the bullish and bearish scenarios in three points each. Right now we're still in a downswing, so short-term the bias stays bearish, but price has stretched too far outside the daily range already. We need to watch for a reversal here, so instead of chasing new shorts, the plan now is to shift focus and start hunting for the next buying opportunity.
In the community-only stream, I walked through this setup even before that bearish candle closed, and we're already seeing the bounce start to play out. The daily chart has been ranging for so long that a small breakout like this often gets faded as a counter-trend level. So I'll stay alert for a bounce here while watching closely to confirm where this downswing finally ends. That wraps up today's gold update.