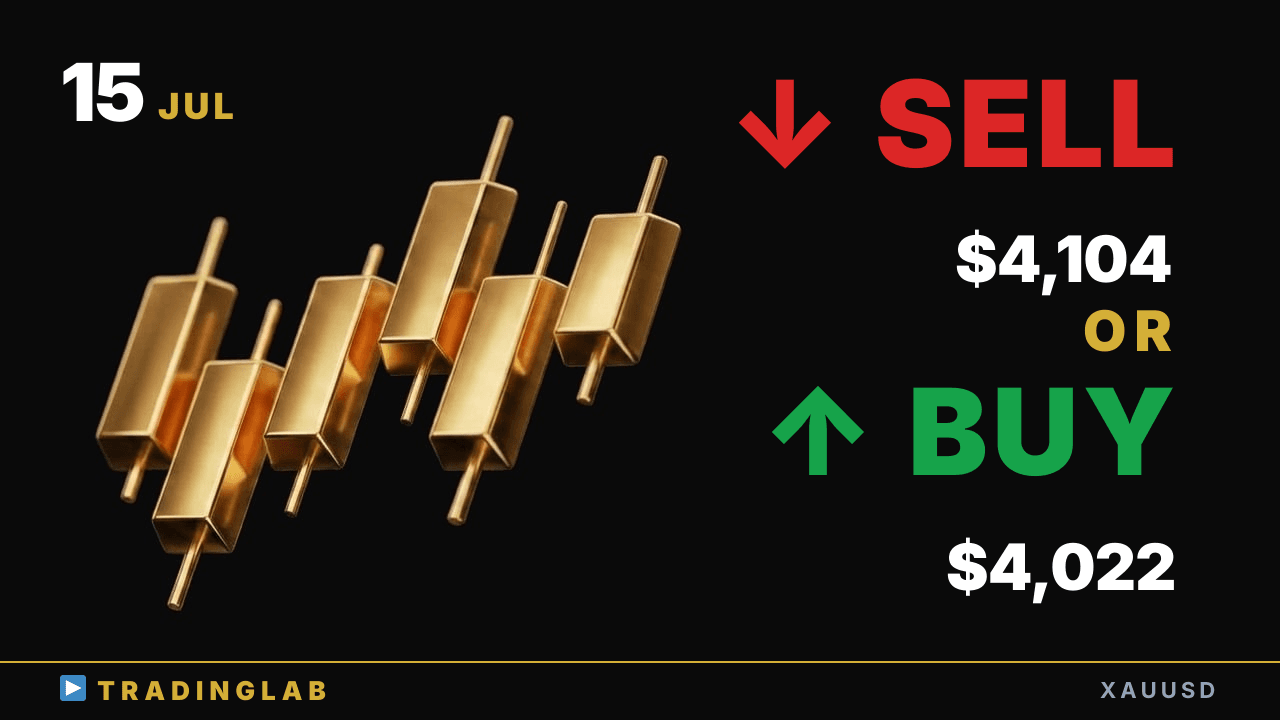
Gold's short-term bias stays bearish, but the daily is coiling into a range between 4,022 support and 4,104 resistance. Daniel breaks down the exact decision criteria for flipping from rally selling to pullback buying. Watch 4,062 and 3,983 for where the next clean move sets up.
Gold at 4,022 support — hold for longs or break to 3,983? | XAUUSD July 15
 Watch on YouTube ↗
Key levels in this analysis
| Resistance | 4,104 · 4,062 |
|---|---|
| Support | 4,022 · 3,983 |
Summary
Video transcript
Hey, this is Daniel, your energetic prop trader. Gold's looking bearish right now. But the daily chart is leaning toward a trading range here.
So today's a day to look for setups in both directions, either side. Last time, just like the scenario I shared in our community, we tested the Tokyo session high. At that point, after rallying around 367 pips, price pulled back into the sideways range I'd been watching as a key level.
Once price broke below that range to the downside, my bias flipped, and it dropped roughly 604 pips down to the recent low. We've had a weak downtrend since the Tokyo session, but depending on the price action, a shift to longs is getting close. Today I'll walk you through those decision criteria and the exact entry points worth targeting.
So let's dive right into the daily chart now. Looking at the gold daily chart, yesterday's daily candle closed as a clear pin bar with a long upper wick right at this level. Last time, I mentioned that with the range gradually stepping lower, this structure made it easy for price to keep falling.
Yesterday's daily candle was an outside bar that almost fully overlapped the previous candle, so we can say price is falling exactly along the structure we mapped out. And as I just mentioned, yesterday's daily candle formed a clear outside bar, By theory, the daily chart's direction tends to get decided in the same direction as the breakout of this particular candle. Basically, on the shorter timeframes we're seeing a fairly strong downside bias right now.
Keep in mind that price tends to settle into a sideways range built around the previous daily candle, and factor that into how you play today's session. Alright, let's move down to the 1H chart timeframe now. Since I took yesterday off from the video, the last community stream was right around where this bullish candle formed that doji-like reversal here.
So what I want to do now is take some of what I broke down for the community members at that point and share a part of that analysis with you here on YouTube as well. First thing I was thinking about was my directional bias. On the lower timeframe a falling wedge was forming, so my main scenario was for price to come back and test the high we made during the Tokyo session earlier.
On the shorter timeframe this shaped up like a falling wedge, so that's the scenario I was leaning toward here. On the flip side, the opposite scenario I was weighing was a downside breakout of the sideways range built off these two candles as the reference bars. I explained that if it broke out to the downside, I'd flip my bias and switch over to a bearish view.
I also walked through exactly how the price action unfolded and how that process led me to settle on these bearish and bullish scenarios. First, let me highlight a few of the candles I was watching on the chart. This long upper-wick candle confirmed that the sideways range sitting just above was acting as a key level, so I rated it as an important signal here.
On top of that, the shape of the candles on either side tells me this zone tends to settle into a range. Also, looking at the internal price action, we got a tall range candle, and after price tested the top of the range a few times, I was analyzing how it would develop next. The weekly open came in with a bear gap, which I've marked here in the gray zone, and that bearish gap at the open was one of the signals suggesting price was likely to roll into a downtrend right from that opening print.
After that, the downswing kept extending, and as I mentioned earlier, it was shaping into a falling wedge. On top of that, there was a second reading here too: these two anchor candles opened up the possibility of a sideways range forming, so at that point we had two valid interpretations to work with on the chart. If the falling wedge does play out, then by the textbook it's very likely to test the wedge's origin.
That origin here is the high printed during the Tokyo session, right on the opening move that created this gap. So that level lines up as a very logical structural point, and testing it back up there was a real possibility worth watching. On the flip side, the bearish scenario: the downswing up to that point had very weak momentum.
The candles were heavily overlapping and there were a lot of doji inside that leg down. So after the correction, there was a solid chance it would roll over into clean, strong downside momentum. That's why a downside break of that sideways range looked reliable enough to short, so my bias here was to the downside.
So how did gold actually play out after I sent the call? Right after publishing, we saw an attempt to test the Tokyo session high. Price broke above the doji to the upside, but the follow-through fizzled out — it stayed trapped inside the sideways range of those two anchor candles.
The breakout failed, and from there price reversed lower. At that point, odds strongly favored a drop to at least the lower edge of the range, and sure enough this bearish candle closed right after probing that lower bound. Once price broke out, I flipped my bias back to the downside — perfect timing.
Downside momentum clearly picked up, a fresh bearish swing formed, and from there we confirmed a move down worth a full 604 pips. After that, price stalled twice around the same level, flipped the trend, and once a strong bullish swing formed it linked into that recent weak downtrend on the Tokyo session. Now, for today's Trading Lab members-only breakdown, I walk through three key points.
Short term, rally selling stays the priority — that's why I called for a downside bias early on — and I explain exactly why. On the daily chart, price is likely to keep drifting in a range. So we also need to consider pullback buying, and I explain in detail exactly which price action to watch before taking those pullback entries, including the levels where I'd flip my bias. That's it for today's gold breakdown.