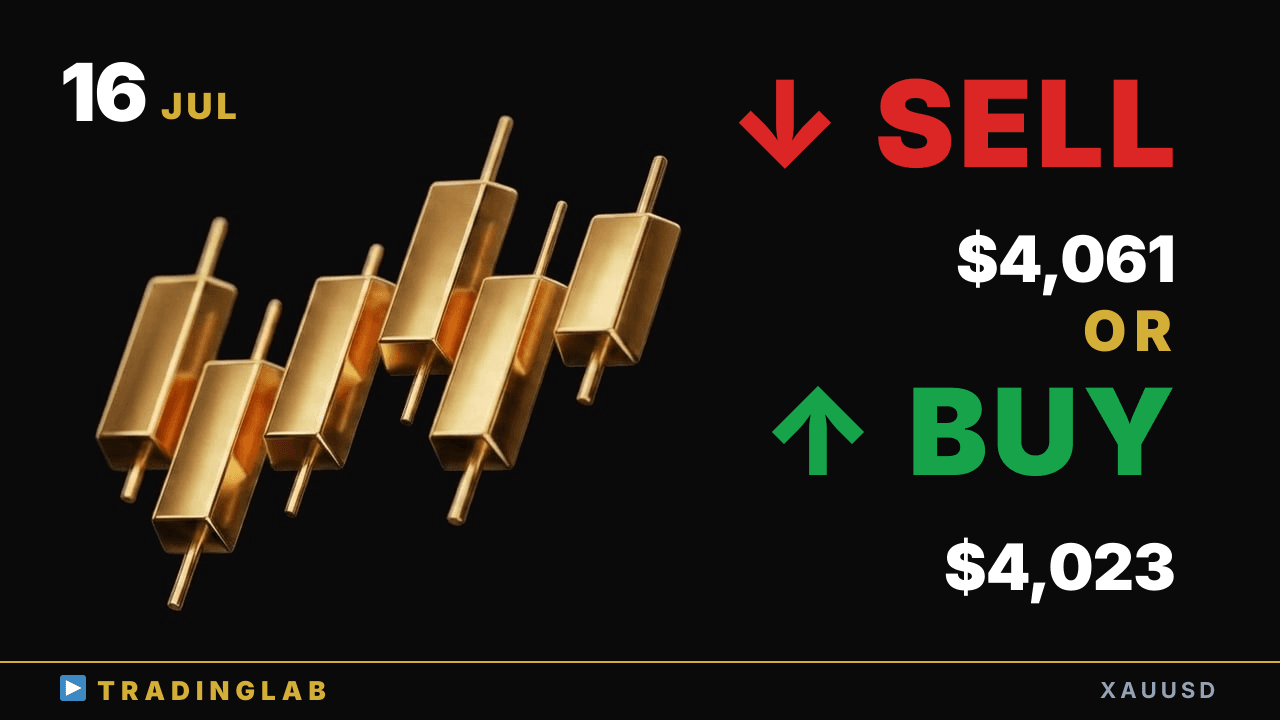
Gold printed a doji inside bar on the daily — downside bias stays, but price keeps chopping inside the range. I map the 4,023/4,018 supports against 4,061/4,083 resistance and the failed-breakout reversal setup. Which side breaks first, and how to trade it without bias into tomorrow.
Gold in Daily Range: 4,023 support vs 4,061 resistance — which breaks first? | XAUUSD Jul 16
 Watch on YouTube ↗
Key levels in this analysis
| Resistance | 4,083 · 4,061 |
|---|---|
| Support | 4,023 · 4,018 |
Summary
Video transcript
Hi, this is Daniel, an active prop trader. Today gold leans bearish overall. That said, the daily chart is still ranging, so we need to stay flexible and follow whichever way it breaks.
Just like the scenario I shared in the community last time, once price broke out of this key channel line we were using as our axis, we saw a move of about 541 pips to the upside. We're still hunting for direction inside the daily range. Today in our community I broke down exactly what to expect after a break, and how to trade it objectively without any personal bias.
Alright, let's dive right in and start today's analysis with a close look at the daily chart. On the daily chart, gold closed the prior session right on an indecisive doji candle. As I explained yesterday, the daily candle sits inside the prior one, so it tends to keep drifting sideways in a range, even though the downside bias itself stays strong.
On the short-term timeframes, I explained you should trade knowing price tends to stay contained within the prior daily candle's range. And as I mentioned, yesterday's daily candle actually printed as a doji, closing as an inside bar fully contained within the range of the prior candle. So this is playing out exactly as our scenario called for.
For today as well, yesterday's daily candle formed a doji, so by the textbook we can expect price to keep chopping sideways inside that range. When you build a short-term strategy, keep in mind the range boundaries and the daily candle give plenty of solid hints, so trade accordingly. Alright, let's dig into the 1H chart now.
On the 1H chart, I'll pick out a few key points from what I walked through with our community members yesterday, and break them down for you now. First, on direction: the previous day's Tokyo session clearly traded as a downtrend day throughout. Let me draw in the lines for each timeframe.
Our last stream for the community members lined up right around where this red bearish pin bar formed. And as I said, through the Tokyo session that day, price drifted lower from open to close in a clear downtrend. The key point here is that the downside momentum was never really that strong.
Right after the open, that first big bearish candle came in with powerful momentum, but after that it formed a bearish doji, and the candles started overlapping, drifting down only weakly from there. On the other hand, since I was framing the pullback around the daily range, I wasn't really looking to short from here. Instead, I was focused on planning a long entry after the reversal played out.
And inside our community, I walk through the whole process step by step, right up to the actual long entry after the reversal. The first candle I was watching here is actually the one where the breakout failed to hold. Looking at each sideways range, at a point like this you can see a range forming right off this doji, and while it first failed on the downside breakout, price then went on to break out to the upside instead.
When a breakout fails in one direction like this, price very often reverses and runs the other way instead, and my base case is that these setups tend to break out in the opposite direction more often than not. After that first upward swing finished, running from here up to here, the setup formed for a sell, and price dropped three candles down, then right at this level you can see fresh longs stepped in again. Just before that final climax sell-off, we had this doji sitting right here, and that spot originally acted as a short trigger, but since price has now broken back above it, this level should easily draw attention as a resistance zone going forward.
We got a clean reversal low here, which set up this bullish swing, and even that final climax candle closed in a really textbook way, and after that we saw what you'd call a two-legged corrective pullback develop from there. When price pulls back to just below such a strong bullish swing, at the very least you'd expect the buyers who went long right there to defend their position, so I was watching that level closely. After the weak Tokyo-session downtrend from the day before, my plan was to look for long entries once we saw that reversal confirm.
So how did the market actually play out? The day before, price broke out above the channel line I'd been treating as the main axis of this trend. On the 5-minute chart you could clearly see a double bottom confirm that reversal, and after a brief consolidation it built a strong bullish swing higher.
Also, since the daily chart was still moving inside a range, rather than aggressively chasing a fresh high from here, you really want to think about closing positions around each session handover, and near the daily highs it makes sense to start locking in take profit. What I was explaining is that you really need to think about trading both directions. From here, if price climbs another 54 dollars, or 541 pips beyond, that builds a sell setup.
Then into the New York session, it drops back down as if testing this long entry point again, and once it flips back to longs, the high does technically edge up, but on the daily chart it still ends up finishing inside the range. So for today's session for our community members, I walked through three key points in detail: how to play the daily range, the plan of waiting for the move that follows a breakout, and the knack for making trading decisions without letting your own bias creep in.
I also broke down exactly how to position and play the market later today. The daily chart is ranging, so stay flexible and switch your bias fast. That wraps up today's gold analysis.