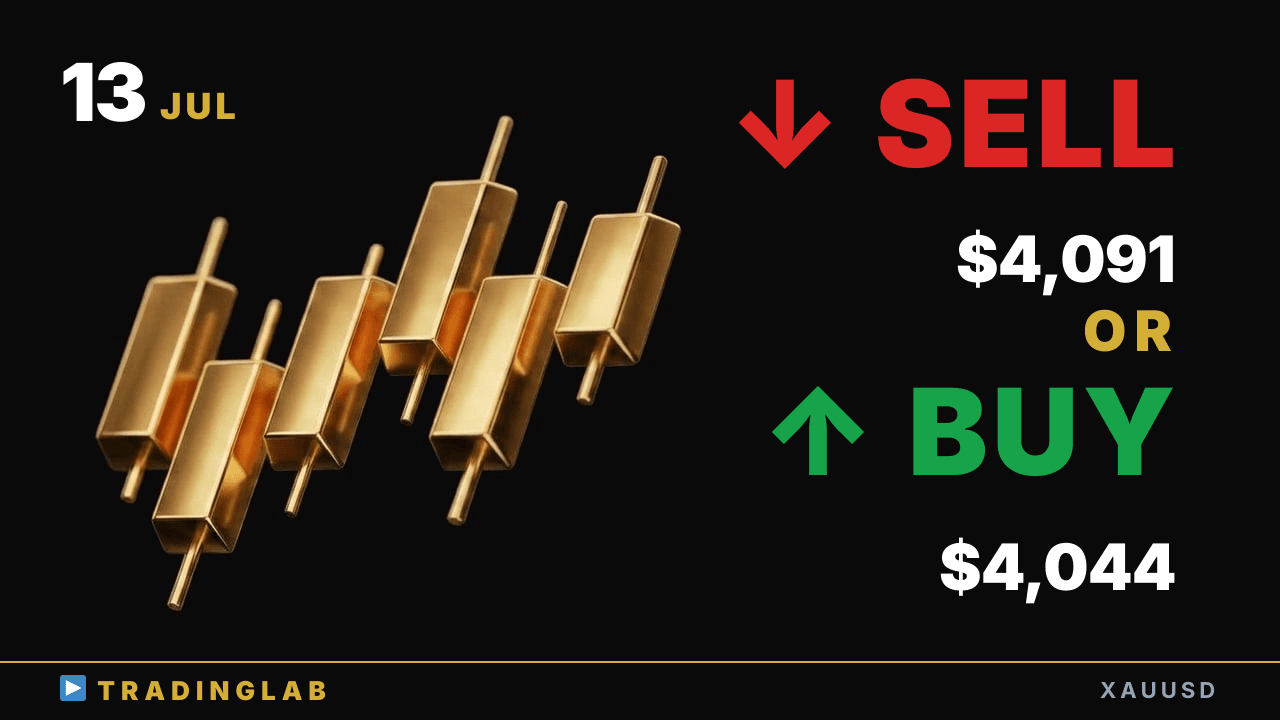
Gold broke above the descending trendline of a falling wedge, but a doji at the top keeps both sides in play. I'm watching 4,072 as the pivot — a hold could run toward 4,091 resistance, while a break below 4,044 flips my bias short. Both trade plans mapped for the week ahead.
Gold breaks wedge at 4,072 — push to 4,091 or drop to 4,044? | XAUUSD Jul 13
 Watch on YouTube ↗
Key levels in this analysis
| Resistance | 4,091 · 4,072 |
|---|---|
| Support | 4,044 |
Summary
Video transcript
Hey, this is Daniel, your prop trader. Gold's looking bullish today. That said, we could also form a sideways range here, so I'm watching for a downside breakout to flip me into a bearish, sell-side bias.
Just like the scenario I laid out for the community last time, once the doji broke to the downside, price dropped straight down by a full 447 pips, exactly as expected. Right now we're seeing a falling wedge take shape, and it looks like price has just broken out above the descending trendline capping that pattern for now. Will this uptrend keep pushing higher, or are we about to see a shift back to the upside?
Today I'll walk you through both scenarios and exactly how I plan to trade each direction. So let's dive right into the daily chart and break it all down step by step. Gold's daily candle from last Friday closed as a bearish doji, right at the top.
The candle that had formed originally was this bearish doji, and Friday's daily candle sits inside it, printing right up near the upper boundary of that range. In terms of shape, you can read it as a bearish pin bar, but if you factor in how price has actually moved up to this point, It's a doji forming near the top of a sideways range, so that's the setup here. Basically, there's a good chance we won't see any real pin bar behavior here, that's my read.
So the way I'm reading last week's closing daily candle is as a bearish doji, a bearish cross. Now let's move to the timeframe and look at the 1H chart. On the 1H chart, right around this red-line zone where a bearish candle formed, I ran the live session for our community members over the weekend.
Let me share a portion of what I covered in that session right here on YouTube as well, so you can follow along. The candle I was watching first here is this bullish doji-style candlestick. I was focused on this bullish doji candle, explaining that we're at the stage where the breakout direction will tell us where price wants to head next.
And as always, I walked through every price move that led me to this call in full detail. I picked out a few candles here, and the reason is that recently these candles kept failing to break out. Price action with a clear direction, what we call a pullback move.
This is exactly the kind of setup where we wait patiently. We're also taking a close look at the price action before this range formed. Last week we saw a strong uptrend with really powerful momentum going.
From Thursday into Friday, though, the flow shifted and we moved into a sideways trading range. Just before that, we had also formed a similar sideways trading range. As the reference candles, these two candles set up a clear sideways trading range.
Inside this range, we're seeing a failed downside breakout happening right here. A failed breakout like this often works as a signal that price is about to swing hard in the opposite direction. And after that, price kept swinging higher just like that.
But if you look closely at the candlestick action here, Looking at the upward swings, the first, second, and third, the third one basically overlaps almost entirely with the previous move. So this clearly shows the upward momentum had already weakened quite a lot here. After forming this pin bar, price got forced higher unnaturally.
The candles that followed nearly all overlapped. Plus they formed as doji candles too. Once these candles formed, I explained it becomes fairly likely we'd shift into a sideways trading range from here.
And since we've now confirmed a solid upward swing continuing here, I explained to the community that from here we'd read the direction fresh, following the breakout. So how did the market actually end up moving from there? Price broke down out of the sideways range, then pulled back in.
After that direction gets decided, and I think we see a drop of 447 pips, a 44-dollar move to the downside. It's kept falling since Monday's open Overall, the Tokyo session today has been building a clear downtrend structure Here's what I covered today in the Trading Lab breakdown Three key points overall — I posted this while a falling wedge was still forming, so at this stage For now, we can expect a rebound move to play out first, at least initially here.
As I said at the start, bias stays up. And right now price is starting to recover too. These two candles could set up the base for a sideways range here.
If price breaks below this sideways range to the downside, then we'd need to flip our bias over to the downside here I break down all of these key levels in much more detail for you. That's it for today's gold update.