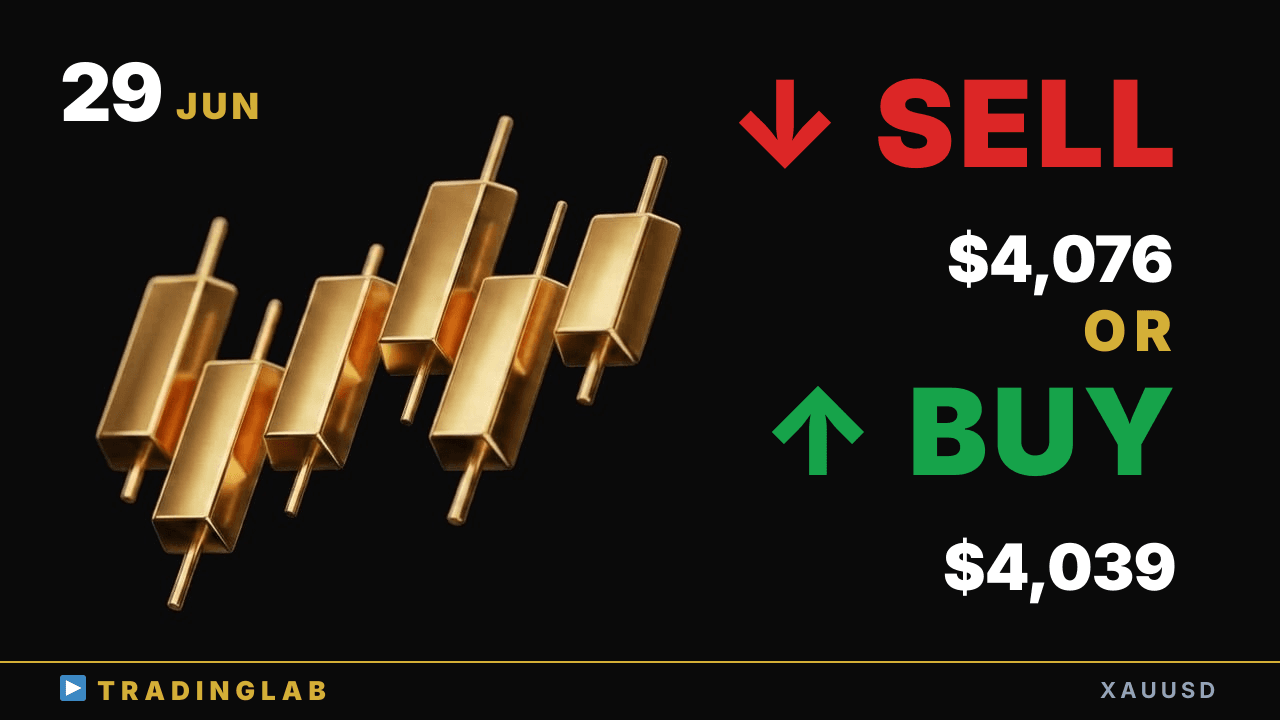
Gold broke its minor descending trendline after an 891-pip swing — is the next leg up forming? I'm watching 4,039 and 3,982 support against 4,076 and 4,095 resistance. Bias stays bullish, but the channel below could trigger a short-term pullback first — here's where I'm watching for the next entry.
Gold above 4,039 — extend to 4,076 or correction first? | XAUUSD June 29
 Watch on YouTube ↗
Key levels in this analysis
| Resistance | 4,095 · 4,076 |
|---|---|
| Support | 4,039 · 3,982 |
Summary
Video transcript
Hi everyone, this is Daniel, an active prop trader, and today on gold The bias is up, but right now we're below the Tokyo session low in a channel Price is drifting higher, but this is just a move against the uptrend I'm reading this as a corrective phase, and since last broadcast the scenario has played out: the upside swing kept extending, rallying roughly 891 pips higher just as I expected. Today gold ranged in the Tokyo session, then we entered London.
The current downtrend has formed, so from the daily candle on I'll break it down in detail. Let me walk you through the analysis. Looking at gold's final daily candle from last weekend.
It closed with a long lower wick on that candle, and now that this candle is confirmed, what this tells us is, first, we've got an upward swing forming there's enough pressure behind it to keep this move going, and why the size of the prior session's move leaves plenty of room here it edged higher then printed a long lower wick, meaning at the cooling level it tested lower then reversed, so opening pressure shows meaning the level is working well,
and the distance from the close up to the high Looking at it, it only leaves a short wick, so the candle shape here is clean Likely it pushed strongly from the open through to the close So you can read it that way, matching the market we tracked before My read is one machined swing from here to here, and then a slight pullback after that After that correction, the second machined swing follows on So at least here we got that two-leg move, and from
my view reading the price action, I expect the same two-leg move ahead So I see a strong chance an upward swing forms here from this setup Price just broke above this recent minor descending trendline right here So the bias leans to the upside here, while the opposing downtrend still sits below Looking back at the price action, you see a clear lower high forming here The line runs like this, and you could connect it here Either way, you can clearly
see a big enough gap forming here So both medium-term and short-term, I'd lean toward a bullish view here The pullback we're seeing here looks pretty reasonable to me overall Now let's walk through the 1H chart together and review what's happened since last time The community broadcast was right at this red line, the long upper-wick reversal candle We sent the broadcast right as that candle formed, so let me walk through what I covered To give you
the quick rundown, first off, on this candle we got one phase of corrective adjustment playing out That phase wrapped up, and price tapped the channel's shadow perfectly, giving us a really clean setup It formed the setup, then reversed, and with this reversal candle we got our signal We can read this as the first upside swing having completed here, and then I figured the upside swing would likely keep extending after that. Because lately we can draw a clear descending channel line here.
After overshooting, it built a clean setup here. So as a reversal and trend-change signal, it's quite reliable here. It closed in a clean way, and recently it formed this kind of half-baked shape.
It made a reversal candle, but where do these bears cut losses Most clearly, it's once price breaks out above this swing high Once that happens, that's where we cut our stop loss An upside breakout could run hard and fast from here And higher up, short positions were also being set up in the same spot A point that also acted as a sideways trading range So price chops around briefly here before pushing higher Once it breaks out, we then get a resistance-to-support
flip And it becomes easier to confirm that level holding as support So there was plenty of fuel here to push price higher in a straight line So I figured the upswing was likely to keep extending higher here So my previous scenario was for this rising swing to keep on extending higher My bias was bullish, and looking back, even after I posted the call it held up well You can clearly see the bullish swing just kept extending After this reversal candle
printed, the trend flipped, and into the New York session Into hour two, NY traded textbook style, exactly by the book For the first two hours after the open, direction stayed clearly consistent So that's an 89-dollar move, about 891 pips, playing out exactly as the scenario called for This is exactly what we covered for our community members in today's broadcast After this, price moved up along the channel, and I went long earlier So I took my first
entry here, but with this kind of downward-sloping channel If we read this line as the uptrend still continuing then we'd see a clean breakout to the upside continuing higher After weighing that, I walked you through one clear bullish scenario And the other point is that this move has already played out to some extent Whether this stays usable later is unclear, but look at this downtrend shape here Reading the trend shape, we're also weighing a short-term sell strategy here For gold today, the bigger picture stays bullish overall, and that wraps up today's session