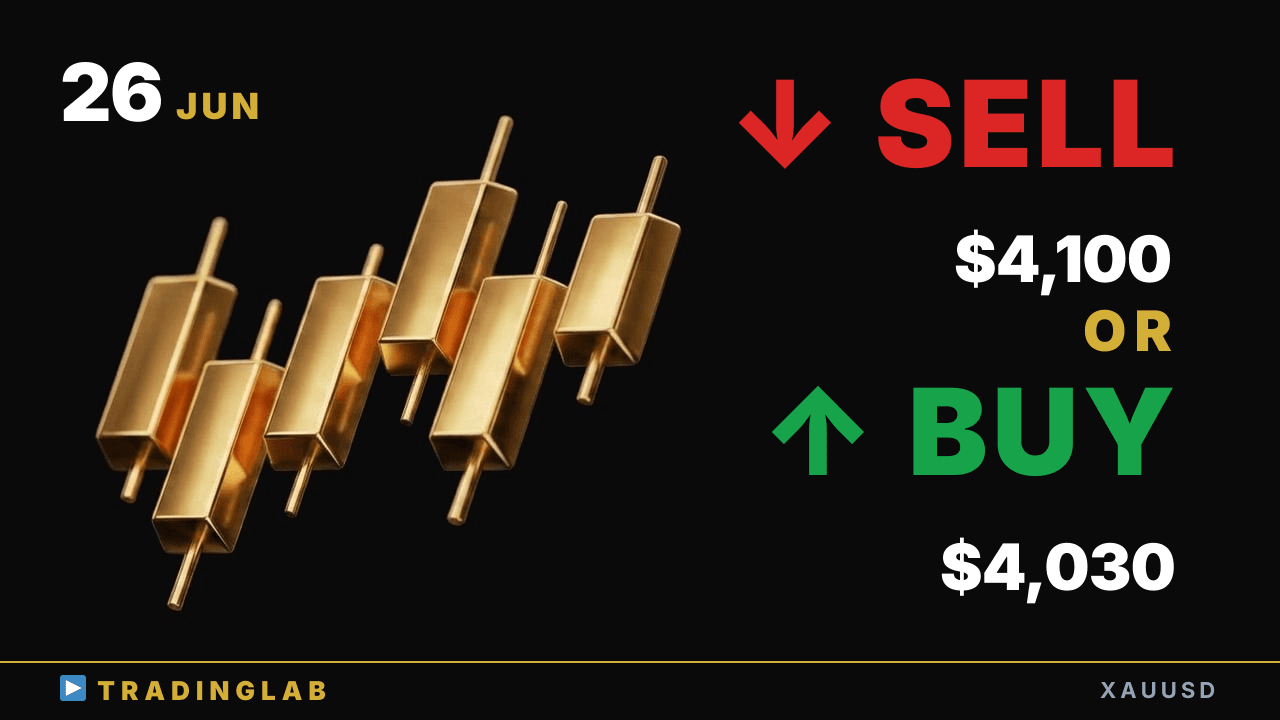
Gold bounced clean off the 4,030 daily level and ran ~704 pips — now stalling into a doji near 4,100. Daniel breaks down the rebound price-action patterns and the 4,023 support that has to hold. The real question: does this confirm an uptrend, or is the breakout a fakeout? Here's where to judge it next.
Gold at 4,030 support — breakout to 4,100 or back to 4,023? | XAUUSD Jun 26
 Watch on YouTube ↗
Key levels in this analysis
| Resistance | 4,100 |
|---|---|
| Support | 4,030 · 4,023 |
Summary
Video transcript
Hey, prop trader Daniel here, and today I'm bullish on gold overall. The long I opened for the community at broadcast time, I'm closing out for now. That long is now fully closed, and yesterday it bounced right at the daily level.
Just like the scenario I described, the setup formed cleanly after I posted it. Once it formed, price climbed roughly 704 pips, right in line with the scenario. Today I'll cover the price-action patterns you can use to spot these rebounds.
Alright, let's jump right into the detailed daily chart breakdown. So let's get moving. Looking at yesterday's gold, the daily candle closed cooling off here.
As for the shape, it confirmed as a doji right at the close, and originally from here on. If we say a fresh short-term downtrend has just started here, then the bounce wraps up right here and price carves out a second downswing lower That was the setup, so we got a clean two-leg move developing here That measured-move leg pushed past the high with a slight overshoot It overshot, and at the cooling level we got this kind of bearish setup That zone lined up with the channel line, so the cooling setup was solid A bounce was the real risk
there, so I was flagging that rebound caution That's exactly what I said, and it did close on a rebound, so today let's look closer The key focus here, looking at this doji shape, is the strong downside momentum just before we have to ask whether this is really turning into an uptrend now We just can't make that call yet, so let's see where we can actually judge it Where exactly?
Right at the current move, breaking this high to the upside If it breaks out, the bulls will naturally call it a shift to an uptrend They'll start buying from up here, and the stronger that push gets the odds of flipping into an uptrend really start to rise this current breakout, if it keeps pushing higher with strong upside momentum then naturally the daily chart confirms an uptrend taking shape here so we also need to keep a potential reversal on the radar here So which way it breaks is honestly tough to call right now Alright, let's go through this on the 1H timeframe step by step Let's take a look.
Last community session was around this red line We were trading right around where that bearish candle formed, with details limited I can't cover all of that in this video, but today I'll narrow it down to a few key points and walk you through them today. First, I had two scenarios in mind yesterday. The first one is this candle.
A three-push-down pattern that captured the lows of this candle and this one. Then it reverses without breaking below that low, the so-called That's the rebound scenario, and if we treat this as a strong, bullish market, that's what we'd expect. That was one scenario, and the other one is what we call a symmetrical setup.
It's a triangle here, a symmetrical triangle, and naturally this pattern means By the textbook, since it's forming right in the middle of an active downtrend there's a strong chance it eventually breaks out to the downside here I was treating this as the weak scenario, a return to the downtrend But which scenario is more likely to play out? Looking at the recent downtrend here price has dropped right into a zone where this kind of decline makes sense like a final triangle consolidation pattern, or maybe a flag forming here That kind of pattern very often ends up as a fakeout, honestly.
So overall, the scenario where price bounces back up is the easier one to play out here. That's the point I think I'd already shared with you all. And inside the community, I break down all the smaller moves every single time.
The candle I was really keeping an eye on first was right here, this one. Where exactly was it again? Right here, this candle is what I was watching.
At first it looks like a trend reversal. It looks like a strong candle ready to push up, but on candles like this, longing right away you can't really enter around here, and honestly this push up didn't really happen. The reason you can't enter here, at least is that a trend shift only comes after a breakout so I drew this minimal recent swing high as a reference With the descending trendline still not broken to the upside a long entry never set up, and price then kept slipping lower here we formed a doji right at this key line, and the next focus shifts onto this is this candle here, and since it formed a doji on the key line, the bounce stayed weak and there
wasn't really any setup to trigger here either, given that doji line forming That's because it's an outside bar against the prior candle short-term It tends to push in the breakout direction, and it broke lower So it made a new low, playing out just as the theory says And the candle I was watching closely is right here, this false candle one Breakout and FBO, the abbreviation, you can see it written right here too, the upside A failed upside breakout,
and where it broke out from This sideways range here, the upside breakout from it failed as well It failed there, then reversed, and tested the upside as the theory suggests Since it failed there, price reverses to the downside, and within that flow you could read it as a triangle, a three-push down move That was the kind of move you could read either way, and an hour after the call it then formed a reversal low here, giving us a clear buy signal
This was a high-probability setup point, at the very least here In this sideways range we're near the floor, dropping into a three-push down Then a reversal low forms, so this swing low likely holds as support A break below it looks unlikely, so I'm leaning toward a bullish scenario here That's how I'd approach trading this setup, and after the stream went live, this After a pullback against the reversal low, a clear setup formed here With the buy
setup formed, longs go in here, and then twice more after After the upward swing, we're seeing higher highs confirmed on the chart. This rally played out exactly as the scenario predicted, a clean 704-pip move higher. In dollar terms that's a 70-dollar move, and that wraps up yesterday's published scenario.
Now today's broadcast for the community is covered in the video. As I mentioned at the start, the swing structure helps confirm a bounce. I break it down in detail, fully analyzing these bounces within a downtrend.
We watch what kind of move signals the end, since fake spikes are everywhere. Even within the trend, to dodge these fakeouts, we check what kind of setup forms. How often, what structure forms the swing, and how to read the bounces.
And as always, I walk through today's strategy too. I trade through a prop firm account while I walk you through it all. For timing reasons, I already closed out my long position here.
Let's look at the levels price could realistically climb toward. Today I'm walking through the daily chart focus levels in full detail. Gold stays bullish here. That wraps up today's session.