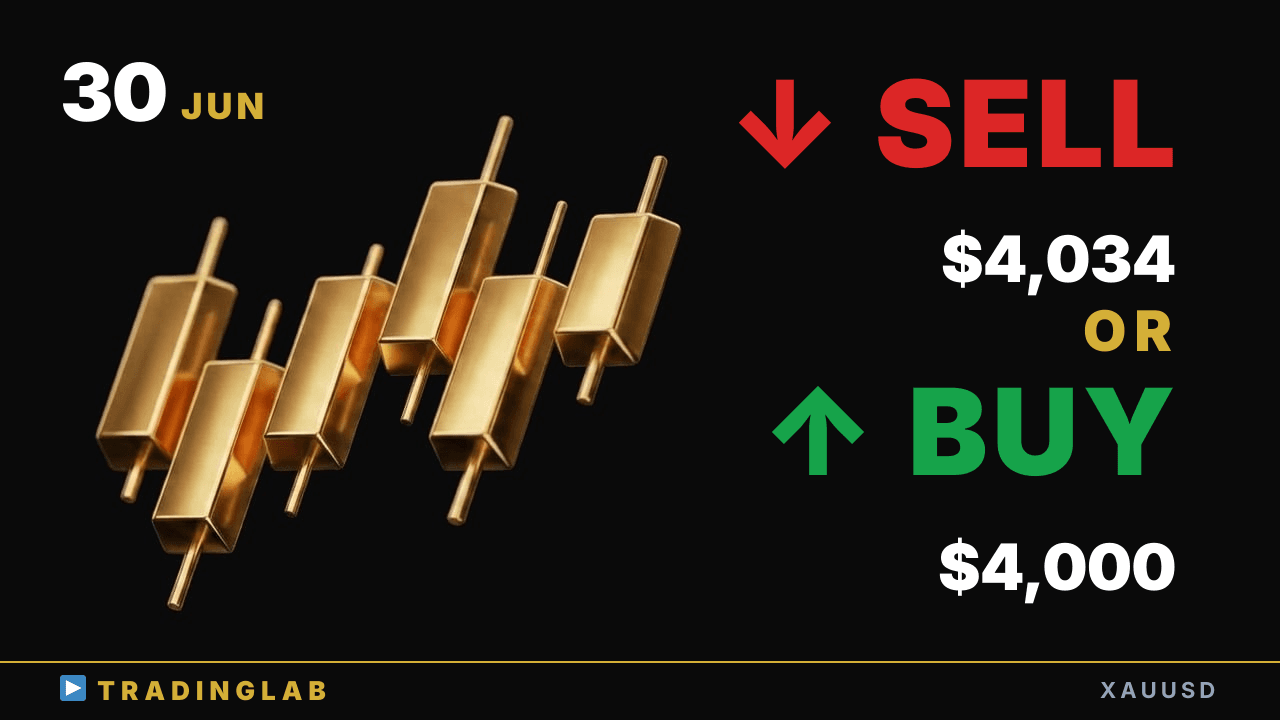
Gold sits at the channel's lower edge near 4,000 after a sharp ~773-pip drop. Daniel breaks down why today's daily close is the pivot: a bearish body keeps the bear channel alive toward 3,942, while a strong real body sets up a double-bottom toward 4,034–4,083. Watch the H1 channel break for when to flip your bias.
XAUUSD at 4,000 — daily close decides: breakdown to 3,942 or reversal up? | Jun 30
 Watch on YouTube ↗
Key levels in this analysis
| Resistance | 4,083 · 4,034 |
|---|---|
| Support | 4,000 · 3,942 |
Summary
Video transcript
Hey, this is Daniel, your prop trader, and right now gold is sitting here. So the bias is up, but this move was built right through the Tokyo session. Jumping straight into this big move isn't a strategy that trades well here.
I think that's the higher-probability scenario, and since the last update, price broke out below the channel line we'd been tracking And from there, the prior day saw a sharp drop of roughly 773 pips playing out on the chart. Personally, in real trading, switching your bias fast beats predicting it. That's my view.
So which points signal when to flip your bias? Let's break it all down in detail. So right away, let's start with the Tokyo session.
As for the previous Tokyo session, it closed as a bearish candle, and the one right before it. It closed inside this key candle, so naturally it's an inside bar. So until price breaks out of this candle, we really can't commit to a direction.
And on top of that, this candle itself is a doji, so the same kind of effect tends to show up here. So I think that same kind of effect tends to get confirmed here, which means breakouts tend to fail and price gets pulled back inside this zone So we're likely in a setup where that kind of magnet effect tends to kick in here. And recently the lower edge of this long-watched channel line really matters.
Each time price touches it, we bounce again, and the line itself tries to slip back inside this channel. So that pull-back effect is confirmed here, and now there's one key point I'm watching closely. Today's daily candle is critical, and the bearish scenario really hinges on it.
If it closes leaving a real body on a bearish candle, then this bear channel stays valid. Plus the lower bound, and the stop loss on this recent bull wave entry from the pause here. So it could easily get caught up in that move and drop sharply lower from here.
On top of that, For the bullish case, we'd want today's candle to leave a solid real body like this. The bigger that real body is the better, then we reverse up from here. That gives us a double-bottom kind of effect to confirm here.
As I mentioned in yesterday's stream, this minor move broke the descending trendline, then retested support twice after so it's effectively behaving just like a double bottom here In this setup, if the broader downtrend keeps going, the channel still gives us a guide.
the upper edge, or a downtrend line drawn off these swing highs there's still a gap left up to that line, so when this plays out then over the medium term the odds of a bullish reversal start climbing higher Alright, that wraps up the daily chart, so let's check the 1H On the 1H, just like in yesterday's community session here The session for everyone formed right around this red line with the long lower wick I want to walk you through the key points right here on the chart too Yesterday I explained that we'd first prioritize the blue flag setup while also weighing the chance the downtrend keeps going in parallel That was the broader bias I laid out in detail.
So first, let's go through the bias itself. The key reference for the shift and how price moves from here was this exact level. The descending trendline drawn connecting this candle to this one, and this A channel drawn at the same angle as the trendline, anchored to the recent lows.
Around this channel line, I'm thinking about flipping my directional bias. Here I could also draw the channel line right at this point. Once that low is set, I basically widen the channel to capture more candles inside it.
I think the right approach is to enclose them all, like this. I've drawn it on the chart, where price breaks below this channel line here. If it breaks out, of course that blue flag I covered earlier That blue flag scenario breaks, so I'd flip my bias to the downside.
That's the shift I'd be looking for. And conversely, if price breaks out to the upside instead, that upswing carried solid momentum behind the move here It was strong, so as long as price holds above here and the bull flag confirms, again A larger upswing becomes very likely, so from here we look to target those points and hunt for long entry setups That's how I read yesterday's market, and as usual we'll review from the prior day I'm also recapping the price action, and the first thing
I was watching was right here This is a buy setup that formed right after a big bearish candle here Looking here, several factors lined up for a really solid buy setup That was the setup, and in this video I'll walk you through three key signs Let me start, and the first one is obvious — looking at the recent price action It touched the lower side of the rising trendline I drew The second point is this channel line shaped exactly like this Price kept
pushing higher along it, but now we clearly see a breakout where price overshoots the lower edge of this channel, an extension move short-term, that candle reads cleanly as a selling climax bar here that was the setup, and there's a lot of lines so let me clear them As you can see, the lows keep stepping up nicely while the highs are getting closer I think we can keep pushing into those nearby levels, so let's look at this move This candle pushed
up hard from the open right into the close, very strong So personally, I'd go long just a little above this swing high here This is exactly where you should set your buy stop and go long That's my reasoning, so this was a clean buy setup taking shape here So I was watching this candle closely, and on top of that, another buy opportunity was setting up here And that was on this candle, right when yesterday's stream went live, this candle on the recent
channel here Price overshot the channel line drawn back then After reversing there, the candle confirmed the uptrend and lined right up at this pullback zone It overlapped with that level, so a long entry was viable here Above this we had a sideways range forming, and that looked like a possible false breakout setup here So this doji's high was the level we wanted to watch here We expected a push toward that target, a solid long entry too That was
the entry point, and let's see how price actually played out This entry eventually printed an indecision candle partway through the move It formed a doji, then broke down, so we closed at the lows here That's how it played out, and this was the level I used to flip my bias After it broke below this channel line, this point right here made a pullback-style move, and counting from here lines up perfectly This becomes the pullback candle, so I'll track
it starting from the end of that low. That's about a 77-dollar move, roughly 773 pips, playing out exactly as the scenario laid out. It sold off cleanly, and this channel line really proved its worth.
As a bias-shift point, it was genuinely useful for trading here. I think it was a market we handled well. Today's content for the community.
I'll break down three key points here, and after this the rally ends. The structure after this — right here the upswing has wrapped up for now. Let me break down the structure that forms after this upswing finishes.
The bias-shift point, the cleaner setups ahead, and today's full strategy. That's what I shared today. As for gold right now, at this point, I'm bullish here. That wraps up today's stream.