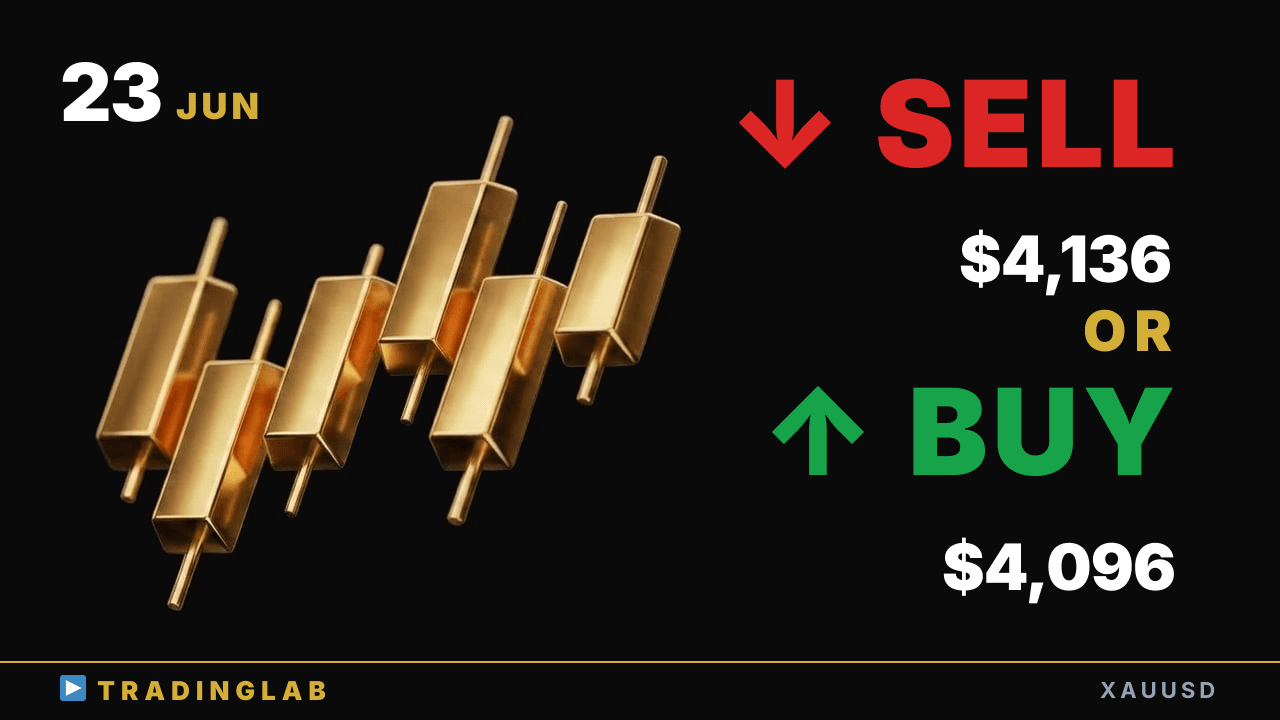
Gold's H1 downtrend is mid-move after a 263-pip rally and reversal at the FVG. Daniel watches whether this bounce wraps near yesterday's low — a break below 4,096 opens the C-leg toward 4,023, while bulls still eye 4,136 and 4,198. Here's where I'm watching next.
Gold downtrend live — does the pullback hold 4,096 or break to 4,023? | XAUUSD Jun 23
 Watch on YouTube ↗
Key levels in this analysis
| Resistance | 4,198 · 4,136 |
|---|---|
| Support | 4,096 |
Summary
Video transcript
Hey traders, this is Daniel, your prop trader. Today's gold on the bigger picture keeps a bearish bias. The key is whether the bounce wraps up near yesterday's low.
Yesterday the rise played out just as I shared in our community formed another pullback at the FVG and rallied 263 pips straight up Then it reversed, and right now a downtrend is in progress I'll also cover how far this price correction could realistically extend Let's dig in. On gold, yesterday's daily candle closed as a doji right at the key level. That candle closed here, and looking at it together with the two prior candles, they almost fully overlap.
At first glance, both the highs and the lows are pushing higher here. It's stepping up, hinting at a possible trend reversal. Looking at the daily chart, the candles are clustering tightly, mostly overlapping.
So we can say a range is forming here, and yesterday's daily candle too. Naturally, from this single candle you can read the day's whole flow. You could say it was basically a sideways range here, this first candle.
You can use either candle as your reference, but what really matters here is this. This tells us the market lacked any clear directional bias during this stretch. If price drops below this candle's low later today and closes leaving a bearish candle body behind, then going forward we'd expect price to come down and test that bigger low around 4,023 That's the kind of move we'd expect here, since price keeps holding at this recent level If it breaks below the low, the first downside swing leads it If it runs from this high to that high, it's higher highs and higher lows Yesterday's daily candle is acting like
a correction phase And after that, it formed leaving this much of the bearish candle's body Ideally, a second downswing — the C leg in an ABC structure — could play out here So there's a solid chance we'll see it play out exactly like that If it comes, it'll likely test this low, just as I expect here That should work, so next let's move on to the 1H chart here Now, what I'd already broken down yesterday for the community was this and the four points
I'll go over next, but the details is exclusive content for our community members, just so you know. First off, let's look at the recent setup and how it followed through with the data. This run is ongoing, marked here by the red line from yesterday's session.
Recently it formed a reversal low right here, then pushed up. The follow-through is continuing, so for now the bias stays bullish. That was the setup, and this recent push higher comes from these two candles right here.
Connecting these highs where price tried to reverse the first and second time gives us this. This way we can draw out the channel line conditions, and using this upper edge here If it breaks out, momentum builds and the expanding type forms I mentioned that we could draw a blue channel here on the chart Or it could reverse right here and slide back inside the same channel And if that happens, we connect the two most recent swing points here Price often comes back to test this rising trendline I explained that, and since the last stream I've
also reviewed how the market played out I covered that in our community, carrying last weekend's upside momentum Bulls held on through a sideways range after an upside breakout failed Bulls kept control, and most recently they carved out this reversal low here This is the process leading up to now, suggesting the uptrend continues here For Trading Lab members, as always, this move here I'm focusing on price action in this breakdown, and ultimately
how gold moved yesterday, just as I told you right at the start Since that setup, the upswing formed once again right here It formed the close, and from here to here the move spans 263 pips total It rallied higher from there, so let's focus on what came next here If you count the candles, our community members will get it After the breakout above and below the channel failed, here too once again we see price testing the trendline drawn by connecting
these two points here This is the price action in the first two hours of today's Tokyo session Price broke out below this channel line into a downward swing As the move continued, the second hour of London printed a doji here Once that formed, price broke out and the current rebound took shape. Now let me walk you through what I cover in the community-focused breakdown today. Let me share a portion of what I'll be covering today.
I'll cover why gold suddenly makes these sharp, explosive moves. Here's a hint: today's focus is failed reversals and breakouts. I'll break this down around the points where stop loss orders cluster most.
I'll walk you through the trader psychology behind that move. Right now the downtrend continues on the 1H, still at watch level. We're mid-move, so the bias stays bearish, and the focus is whether this pullback wraps up around yesterday's low here. That's what I'll be watching for in gold today, so let's wrap it up there. That wraps up today's stream.