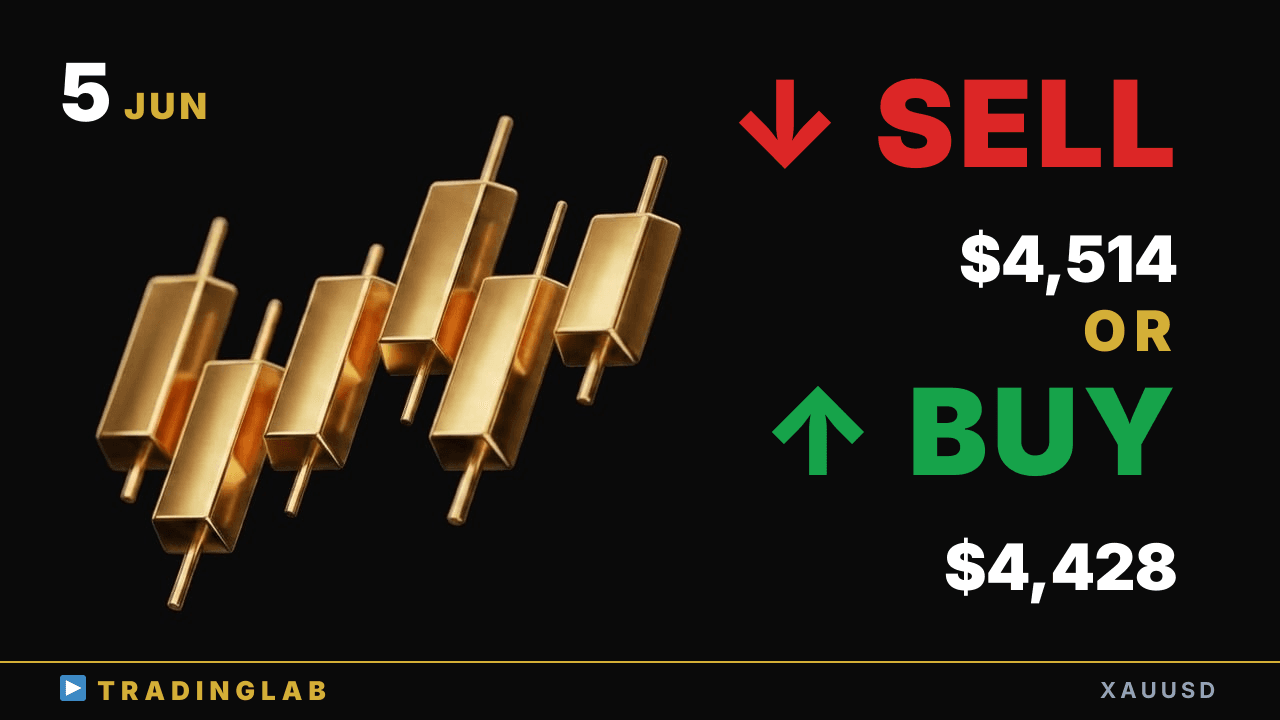
Gold's downtrend stalled and a long lower wick is signaling a potential short-term reversal. Daniel breaks down the key decision zone between 4,423 support and 4,474 resistance — and what needs to happen for bulls to reclaim the range up toward 4,514. Watch for confirmation on the H1 before committing to either side.
Gold at 4,474 resistance — reclaim the range or drop to 4,423? | XAUUSD Jun 5
 Watch on YouTube ↗
Key levels in this analysis
| Resistance | 4,514 · 4,474 |
|---|---|
| Support | 4,428 · 4,423 |
Summary
Video transcript
I'm Daniel, a prop trader with 8 years of experience, helping beginners learn to trade. I run Trading Lab, an FX community for profitable traders. For more details, check the description box below this video.
Today I'll cover gold technical analysis from our community. I'll blend in some of that content as we go, starting with the current hourly view. As always, I'll walk you through the short term outlook.
Yesterday, price followed the bearish bias and continued its downtrend. forming a very strong bearish setup at the most recent price action this descending trendline is acting as key info so we have a confirmed breakout on the short term so right now I'm viewing the market with a bullish bias let me share the short term outlook starting as always with the daily candle breakdown let's look at gold — yesterday's cooling was reflected in the upper wick it has confirmed with a long key level candle, just as we anticipated
the bullish scenario has played out exactly as we predicted the setup was based on a 50 percent retracement into the prior bearish candle body if a key level is confirmed that negates the prior setup, these two candles there is a high chance price will return inside the horizontal range on the base candle in that case, we follow the standard textbook trading approach since the downside breakout has failed, at minimum we are likely to see a test of
the upper range boundary so right now we have a long lower wick forming, signaling a potential reversal this candle is essentially the key one we need to focus on here I think there's a strong chance we can draw a key level from this candle body On the other hand, if price continues lower and breaks out to the downside from here, this key level has a large real body candle closing well below it triggering stop losses from trapped bull positions this
setup makes price likely to drop further from here short term momentum favors further downside keep that in mind this is a key condition worth keeping in mind as a potential trend reversal signal So that wraps up the cooling phase — let's move on to the one hour chart now. The previous stream was recorded right here at this red line, where a Doji candle formed. A Trading Lab exclusive stream was held right around that level, covering the key points.
Yesterday I covered four key points for Trading Lab members. The full details are exclusive content for Trading Lab members only. On YouTube I'll just cover the key points briefly.
Let me start with the first point, which is about our current market bias. The reversal low bounce has now completed and the rally is over. So our bias shifts back toward a resuming downtrend from here.
That's the scenario Daniel had outlined for us going forward. On the other hand, if price breaks out above the recent swing high again, we may need to switch our directional bias on that breakout. depending on what happens, in the London and New York sessions after this one of those sessions will ultimately resolve into a trading range setup That was the key point covered in yesterday's Trading Lab session.
This stream is for Trading Lab members, plus a recap of yesterday's market action. From the Tokyo session's sideways range, we saw a downside breakout followed by a rally. I covered the full process of how the trend reversal developed in detail.
So let me share what actually happened in yesterday's market session. The market ultimately failed to break down below that doji candle to the downside. It then came back, and following the standard theory, up to the range high On the 5-minute chart, you can look for long entries, but only to a point after a series of demand zones, what looks like a buying climax a major demand signal has appeared on the chart, and regarding this kind of setup we won't look for longs here, and there's been no pullback above this level but the price action didn't support a long entry depending on conditions London
and NY may range exactly as expected the rally played out fully matching the bullish scenario ultimately canceling out and settling into a range bound market So this did follow our scenario, but the price range was large So I'll be avoiding trades in this range. Now, let's move on to today's Trading Lab members stream. As I mentioned at the start, I'm currently holding a bullish bias.
For Trading Lab members, I've covered the detailed reasoning and what to expect next. I covered the criteria for switching my market bias in full detail. I also covered what a downside reversal would look like.
I also cover everything from the previous day up to this live broadcast. We do this every weekday, from Monday through Friday, without exception. We review the market's daily price action together, almost every single day without fail.
Detailed breakdowns are shared inside our Trading Lab community. For today, Gold remains bullish on the short-term outlook. That wraps up today's analysis.