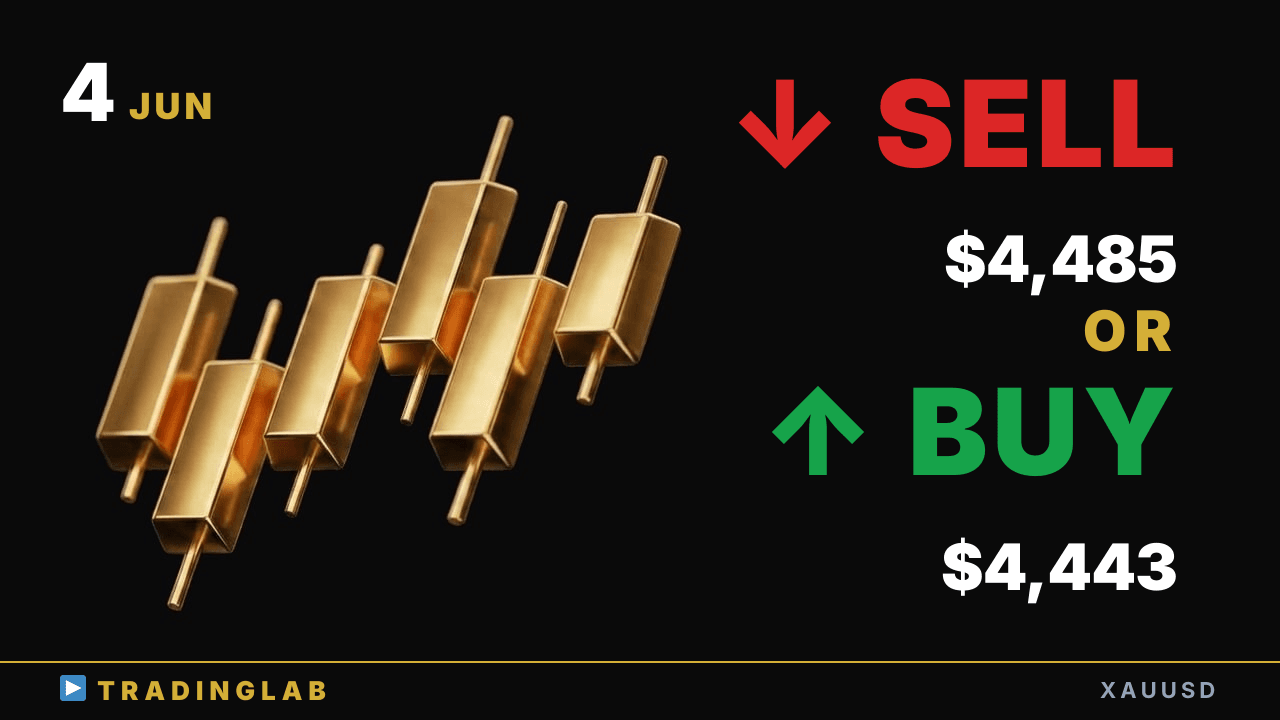
Gold confirmed a sharp bearish candle and broke out of its extended sideways range — but is the momentum strong enough to continue? Daniel maps the key levels: watch $4,427 as the measured-move downside target, and $4,485–$4,496 resistance above. If price reclaims 50% of yesterday's bearish candle, a bias flip toward the upper range becomes the play. Here's exactly where to switch sides.
Gold at $4,427 target — does the breakdown extend or flip bullish? | XAUUSD Jun 4
 Watch on YouTube ↗
Key levels in this analysis
| Resistance | 4,496 · 4,485 |
|---|---|
| Support | 4,443 · 4,426 |
Summary
Video transcript
Hi, I'm Daniel, an 8-year prop trader, helping beginners learn to trade I run a community called Trading Lab for FX traders. For more details, check the description link below this video. Today I'll cover gold technical analysis from Trading Lab.
I'll blend in some Trading Lab content as we look at the 1H chart. As always, I'll share my short-term market outlook here. For today as well, I'm continuing to hold a bearish outlook on gold.
My bearish view is based on the reasons I shared with everyone, as usual. Starting with the Tokyo session — gold printed a large bearish candle yesterday. That bearish daily candle closed and confirmed — that was the key Tokyo session scenario yesterday.
Bulls who went long in the upper wick zone are now trapped. Those trapped bulls are likely holding losing positions right now. So if price breaks below that low, stop losses will trigger.
So the Tokyo session setup tends to favor downside moves. And that downside followthrough scenario played out. And the downside move played out exactly as Daniel called it.
A large bearish candle has now confirmed the move. Is this large bearish candle confirming a downward direction for gold? That part is actually a bit unusual, and here is why, for gold these two candles set the base of this extended sideways range this prolonged sideways range had been holding for quite some time so the breakout naturally drove a strong downward move but yesterday's large bearish candle was no small thing so the momentum here isn't looking very strong right now since it's still smaller than that big bearish candle, a full range breakout so calling it
too early — let's wait for today's candle to close before deciding the direction at this key resistance level First, the bearish scenario: after testing this high, a bearish candle naturally, traders who went long along the way will be stopped out this could trigger another sharp move down making it easier to drop.
Meanwhile, the 50% of yesterday's bearish candle if a bullish candle closes above that level, then naturally it would return to this horizontal range once more the odds of testing this upper resistance are rising we may need to switch our market bias here So that covers the cooling phase, and as for the one hour bias going forward, I'd like to share some points from the previous day's Trading Lab members. I'll walk through some of the key points shared with members.
This analysis is exclusive content for Trading Lab members. Please keep that in mind as we cover today's key points. First, let's look at the horizontal trading range formed during the Tokyo session.
The breakout happened here, not at that earlier point. So this horizontal range was already in play at yesterday's stream, marked by this red line. After a downside breakout, we saw a pullback, then re-entry.
We were discussing a situation where price wants to move lower. So we set our bias to bearish, but now let's talk about flipping it. What price action should we watch to flip that bias?
If this pullback is denied, the next move could fully close that gap candle. if it becomes a rejection, price returns to this horizontal range so there's a real chance price climbs back up to the upper resistance and breaks out so we'd naturally need to consider a bullish trend reversal too so I'll give a detailed breakdown of exactly where to switch bias and if price continues bearish we're watching for a downside breakout from this range how far price could drop depends on this horizontal range I shared $4,427 as the measured move target low in Trading Lab yesterday.
I also covered that in Trading Lab, plus a recap of recent market moves. We had a strong upward trend forming recently, but around this level things started to shift. I did mention this reversal potential to Trading Lab members.
So why did the trend actually reverse into a downtrend here? How to anticipate a trend reversal during a strong uptrend I'll walk you through a detailed breakdown of the previous day's market action. Here's how price moved within this sideways range pullback.
The breakdown to the downside then confirmed and extended further. There was a brief pullback, but price followed the classic theory. We confirmed the resistance-to-support flip again, then price dropped sharply.
Price dropped right to the 3451 dollar low, near the 3427 dollar zone. We can see price testing a reversal right where those lows overlap perfectly. At this point, let me also walk you through the current downside range from the high.
From the recent high down to this target low, that's about 45 dollars in just 6 hours. That's roughly 459 pips of downside, fully in line with the scenario we had mapped out. Today's Trading Lab exclusive content covers this market development.
Today we cover the outlook and key trend-shift levels for later today. After intervention moves, gold is naturally tied to dollar action. Charts are choppy, so stay sharp on shifting your bias.
So keep a firm directional bias as you manage your trades. I'll walk you through the post-move setup and key bias shift points. Yesterday's price action did follow the scenario, though the path had big swings.
Some beginners found those pullbacks tricky to trade today. so let me review yesterday's gold market as always gold remains bearish today, continuing our downward view That wraps up today's stream.