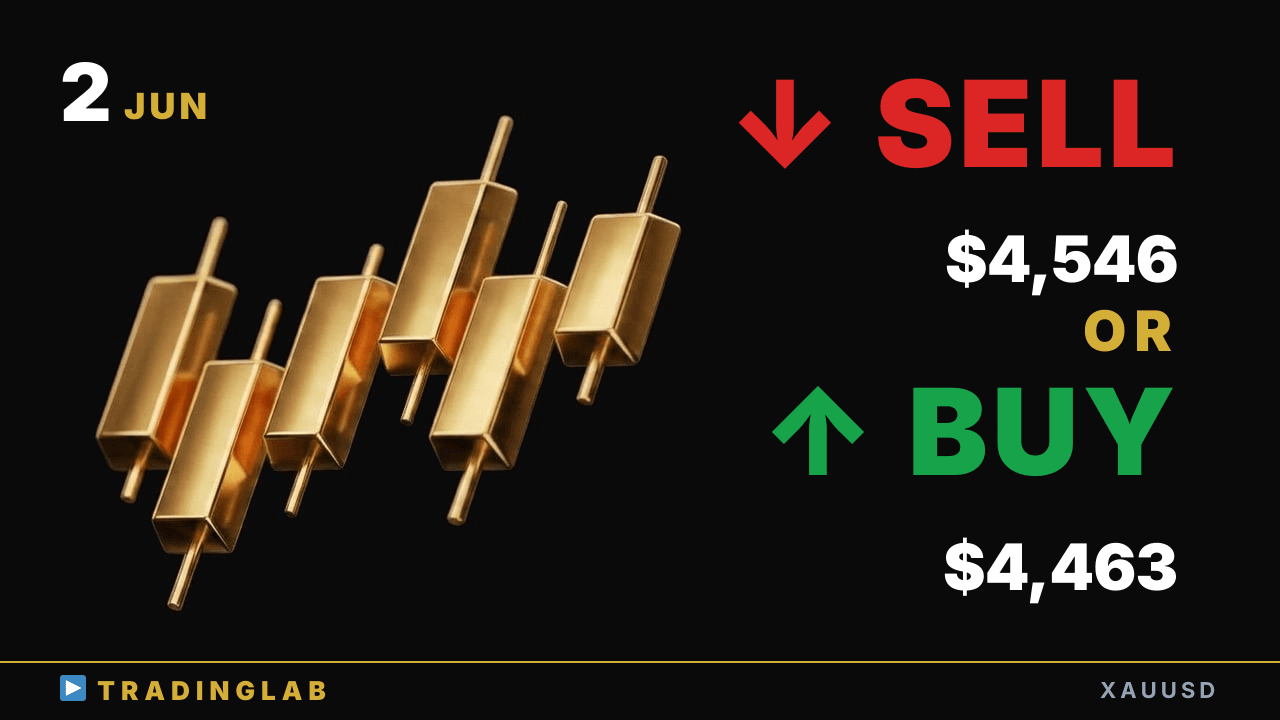
Gold formed a bearish doji on the daily chart and is consolidating in a sideways range — with 4,463 and 4,447 as key support below and 4,541–4,546 as the resistance zone above. Volatility is contracting, and the breakout could arrive sooner than expected. Overall bias stays long, but the direction of the next leg is still open — here's what to watch heading into the next session.
Gold at 4,463 Support — does the bullish breakout hold? | XAUUSD Jun 2
 Watch on YouTube ↗
Key levels in this analysis
| Resistance | 4,546 · 4,541 |
|---|---|
| Support | 4,463 · 4,447 |
Summary
Video transcript
Hi, I'm Daniel, an 8-year professional prop trader helping beginners learn to profit in FX through the Trading Lab community. I run the Trading Lab — check the description for details. Today we cover gold technical analysis, including insights shared inside our community.
I'm currently showing the 1H chart, and as always, I'll walk you through it from a short-term perspective. Yesterday's price action played out exactly as expected, continuing the downtrend with a clear and clean short setup forming on the chart. After forming that structure, we first confirmed higher lows printing, and the recent swing high has since broken out cleanly to the upside, so the trend is now confirmed bullish, so my overall bias on gold remains to the upside, favoring long setups from here.
So let me walk through the detailed breakdown of this setup, starting from the daily chart as always. Yesterday's gold candle closed as a bearish doji, confirming the bearish bias — you can see it formed a clean, well-defined bearish doji right here. The low here lines up precisely with this prior level, and looking further back confirms the same zone.
This aligns cleanly with that level, confirming a sideways consolidation range using these daily candles as the baseline structure. It seems most reasonable to assume that sideways consolidation is still ongoing. Among the scenarios Daniel considered yesterday, these two candles here there was also a scenario where a sideways range forms using those candles as the new baseline, though the concern is that volatility expands beyond the original baseline candle.
Looking back at yesterday's cooling candle body, when we focus specifically on that candle's real body close, the price action after that point tends to become irregular and choppy. So the worst-case scenario has been avoided, with price forming an inside bar that cooled within the prior candle's real body — and we caught this early. So we can confirm that volatility is contracting here, and after this, price should break out in one direction and establish a clear new trend.
We can think of this as the breakout timing arriving earlier than expected, though of course we cannot pinpoint the exact date when this trend will begin. Even so, knowing that the directional move may come sooner than expected is valuable information we can use effectively for our daily chart analysis. With both candles closing in a clean Doji pattern, short-term price action is likely to consolidate in a sideways range, so let's move on to the one-hour chart.
I'd like to briefly share what Daniel covered for Trading Lab members in the one-hour four-level breakdown, though full details are exclusive to the community. Today I can't share everything, but I'll cover three key points from the analysis. So first, when I say today's open, I'm referring specifically to the Tokyo session open and how price moved right from that opening candle.
Right here on this candle, we saw a clear bounce from the opening price. After the strong bounce from the open, price pushed higher and appeared to be reaching what looked like the high of the day. After rising, price reversed with a reversal candle and fell — that was the full Tokyo session price action in review.
This was a clear trend day — a full bearish trend day in terms of price structure. As we enter the London session, our directional bias resets to flat. Following standard theory, but looking at the cooling phase, price tested the upper boundary of the horizontal range before pulling back lower.
So with that setup, traders should consider that the overall bias for the day was leaning toward the upside. In Trading Lab, Daniel covered which candles were likely to act as resistance going forward, plus a recap of the previous day's price action. Last week Daniel mentioned those candles, and they actually ended up functioning as resistance — that was the key point.
Let me walk you through yesterday's market recap — specifically, what actually played out, and what the red line on the chart represented at the time of that broadcast. From that high point, looking at the price range down to the low formed before the New York session open, we're talking a swing of 76 dollars. That's a drop of 769 pips in total, moving exactly in line with our projected bearish bias, confirming the scenario played out just as we anticipated.
And for today's session, I'll be sharing a more detailed breakdown exclusively for Trading Lab members as well. I walked through the full price action process in detail, from yesterday's downtrend continuation right into the buy setup formation and trend development. Since these patterns tend to repeat, I made sure the breakdown connects directly to your next trade setup.
Now let's look at what to expect for the rest of today. I've shared a detailed breakdown for Trading Lab members on how to approach today's trades. Currently gold is under temporary watch, but the overall trend remains bullish, so our bias stays long. That wraps up today's gold analysis.