After a $92 rally off recent lows, Gold has reversed sharply — the daily candle printed a long upper wick and price is now trending lower on the 1-hour chart. Daniel walks through the failed breakout above the consolidation range and what trapped longs near 4,540 resistance mean for next-move probabilities. Key levels to watch: 4,488 support below and 4,508–4,540 resistance overhead. Stay tuned for the two scenarios that could define this week's price action.
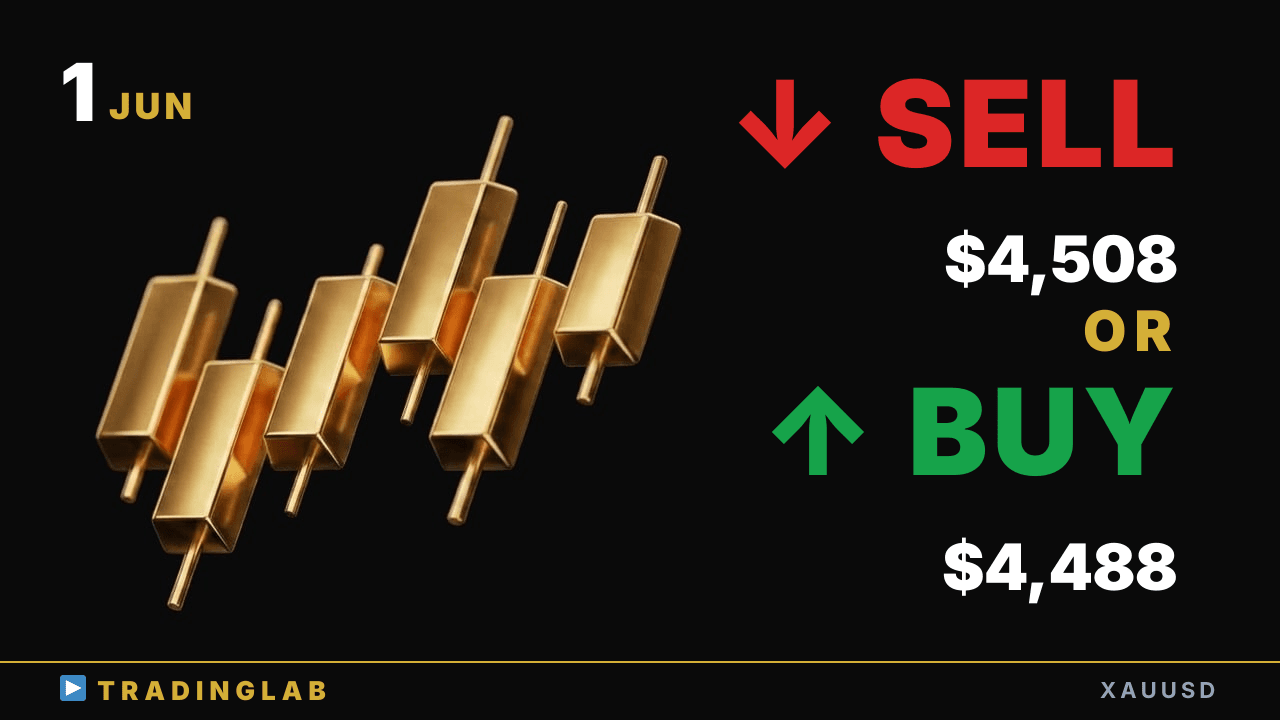
Gold at 4,508 — does the breakdown extend or reclaim the range? | XAUUSD Jun 1
 Watch on YouTube ↗
Key levels in this analysis
| Resistance | 4,540 · 4,508 |
|---|---|
| Support | 4,488 |
Summary
Video transcript
Hi, I'm Daniel, an 8-year professional prop trader helping beginners learn to trade FX and build real, consistent profits. I run a community called Trading Lab — check the description for details. Today's gold technical analysis also includes insights shared inside Trading Lab.
I'm currently showing the 1-hour chart. As always, let's start with a short-term outlook and walk through today's price action together. During the Tokyo session, price was in a full downtrend, so I had already shared a bearish outlook with Trading Lab members ahead of this doji candle forming.
Price has broken below the most recent support level, continuing to make lower lows, so the bearish bias remains firmly in place right now. So overall, price is playing out exactly as our scenario predicted, and the current bias remains clearly bearish. Now, as always, let's continue with a detailed breakdown starting from the daily chart — looking at last week's final close.
The candle closed with a long upper wick, confirming bearish pressure — this is exactly the scenario Daniel outlined in the previous market analysis video. We are currently stuck in a sideways consolidation range, and the most recent breakout attempt to the upside has clearly failed. So on Friday's stream, Daniel mentioned that price was likely to come back up and retest the top of this sideways consolidation range.
Looking at how Friday actually closed, price came up to test the top of this range, and that upper wick right there is definitely worth paying attention to. One key scenario here is a failed breakout to the upside, where longs entered right at this level got caught offside. So longs from that bullish camp likely got closed out, and if it were me, I'd be watching just above that recent high — right above the reversal candle's peak.
Stops were likely triggered at that level, so short-term bullish traders holding longs from that zone probably closed out their positions for profit. So we can say that the probability of further upside remains fairly high. For today, Daniel has two scenarios in mind.
The first is the less favorable one, involving these specific Japanese candlestick patterns on the chart. In this case, we'd be seeing a range form just below, with volatility expanding out from the most recent range, leading to choppy, irregular internal price movement. In this case, price tends to move sideways in a choppy fashion, making it difficult to capture a solid range, so this is generally the less favorable scenario.
The second scenario to watch is whether price can pull back and close firmly below the upper wick from the previous day's candle over today and tomorrow's sessions. In this case, price would attempt another breakout above the range high, likely sustaining a relatively shallow but steady short-term uptrend from here. Ideally Daniel would like to see this bullish scenario play out, but for now he wants to wait for today's daily candle to close and confirm.
Now let's take a look at the 1-hour timeframe. Last week, Daniel shared a more detailed breakdown exclusively for Trading Lab members covering what he'll discuss next. The detailed breakdown was exclusive to Trading Lab members, but today Daniel will walk through the same 5 key points again.
Let me share what Daniel covered for Trading Lab members in Friday's market analysis. First, the Tokyo session price action showed a classic trending trading range structure — alternating between momentum bursts and consolidation phases throughout the day. A series of consolidation ranges formed in sequence, with the overall uptrend continuing to hold its structure throughout.
And in fact, if you pulled up the 5-minute chart afterward, you could see that price did indeed play out exactly in line with that classification. The second point: will the trending or ranging structure seen from the London session continue or break? The third point: the high formed during the Tokyo session on the 2-hour chart is currently showing as an upper wick, and we need to reassess this level carefully.
So we can see that long positions held by bullish traders in this zone are very likely sitting in a loss, which is what I was explaining. So what we want to be cautious of is exit selling pressure in this zone. If price attempts to push higher from here, these trapped bulls are already sitting in a floating loss and seeing weaker upside momentum than they expected.
Some bulls in this zone will likely start considering cutting their losses and exiting. On the other hand, if price breaks out to the upside, we'd be looking at the prior Tokyo session high as the key resistance level. Either way you look at it, this price action is critical — it could sweep the stop losses of bears holding short positions and drive price higher.
Now let's look back at how the market has developed since the previous day. The key point is the weakening of swing momentum, followed by a reversal, then a strong breakout candle on the second retest attempt. So, getting into what actually happened after that detailed breakdown — heading into last weekend, the uptrend continued pushing higher with sustained bullish momentum.
The internal structure has been maintaining a clear training range pattern throughout, so let's go ahead and count out the actual price range for this move. From the post-stream low all the way up to the high reached during the New York session. That move measured roughly 92 dollars, or about 926 pips in total, and as I mentioned, including the internal market structure, it all played out exactly as our scenario predicted.
For today's Trading Lab content, I'll be covering what to expect next in the market, along with a full recap of price action from last weekend. As always, I'll cover it in detail. For today's gold outlook, the Tokyo session showed a clear downtrend, so we remain bearish on gold going forward. So we're maintaining a bearish outlook on gold.