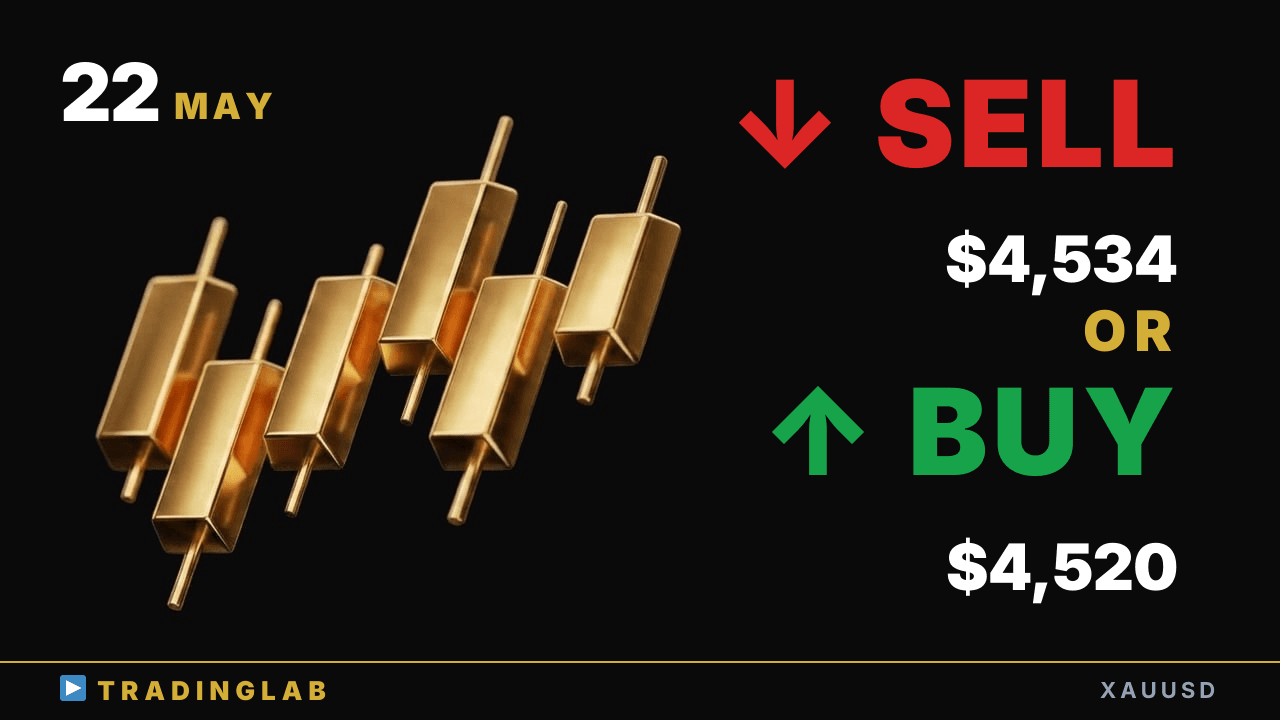
Gold is sitting at a critical decision point after a strong breakout candle pushed above the recent swing high near 4,534. Daniel walks through three scenarios: a bullish continuation targeting higher highs, a bearish double-top breakdown below 4,520 support, or a low-volatility sideways range. Watch 4,515–4,534 closely — the next confirmed candle sets the short and mid-term direction.
Gold at 4,534 — breakout or range trap? | XAUUSD May 22 plan
 Watch on YouTube ↗
Key levels in this analysis
| Resistance | 4,551 · 4,534 |
|---|---|
| Support | 4,520 · 4,515 |
Summary
Video transcript
I'm Daniel, an 8-year veteran prop trader helping beginners master FX trading. I run a Trading Lab for aspiring FX traders. For more details, check the description link below this video.
Today I'll cover gold technical analysis from Trading Lab I'll also share some Trading Lab content as we go. Let's look at the 1H chart I'm displaying the chart and sharing my short-term view first. My current outlook remains bullish, continuing from yesterday.
So let's go ahead and walk through this in our usual format today. I'd like to walk through a detailed breakdown of that cooldown move for you. For gold, the prior day's cooldown has confirmed at the previous session's range.
Watch both the prior day's high and low — either level could break and set direction. Price closed higher, and today we expect a key directional decision at this cooling level. I mentioned this in my previous video, and that analysis still holds here.
Looking at the most recent candles, two bars back we can see the first buy entry setup forming. A buy setup forms here, and the market attempts to follow through on that signal. A large outside bar then forms, negating that bullish move entirely.
The very next candle then breaks below the recent swing low as well. After that breakdown, the market pivots and attempts a full reversal for a second time. So comparing the first reversal attempt with this current one tells an interesting story.
The second reversal attempt is showing more strength than the first. The prior day's close set up a potential key support and resistance test. First, as I mentioned, a large outside bar formed on the chart.
However, this time that bullish setup was ultimately negated. So the follow-through on that signal has partially succeeded. So bullish momentum is stronger than the previous entry signal.
So we can say bullish momentum has clearly strengthened compared to the previous signal. Taking that stronger bullish momentum into account, today's chart is at a critical turning point. So we're looking at three possible scenarios for today's trade.
First, a retest and breakout above the recent swing high, then further upside. forming a large swing — that's our primary bullish scenario on the other hand, a downside breakout below this level remains possible if price breaks below the recent low of this demand zone, the bearish scenario plays out or a bearish continuation inside this demand zone structure forms or a low-volatility sideways consolidation range could form here We need to consider three possible scenarios, so let's go through each one.
Let me walk you through each one in detail, starting with the bullish scenario first. Last time, when this large outside bar formed, normally the outside if price breaks below the outside bar low, look to short this could flip into a fresh long entry setup from that reversal so by the book, a failed breakout to the downside signals upside momentum so we're likely to see a swing form, with follow-through to the upside that's the first bullish scenario Daniel sees as most likely here the second bearish scenario involves a breakout to
the downside on gold but that breakout has failed, and price is now forming a doji candle pattern so a breakout above this sideways range would be the signal two consecutive follow-through attempts to the upside would confirm it so the structure would start to break down and look like a failed pattern it still tends to act like a double top formation in this case and after that, I'm expecting price to break below this most recent swing low to the
downside I'm currently leaning toward the bearish scenario playing out. As I mentioned, the overall structure here is an inside bar forming on the candlestick. So this candle right here is the key — this horizontal range is the critical level.
After a slight expansion, volatility is now contracting here. So this is something we should factor into our analysis now.
When we get a volatility squeeze into a sideways range on the short-term chart, the prior swing was a strong directional move, so continuation is likely so a breakout to the upside looks most likely overall so that sums up the breakout situation, and this key level really does matter what matters most is confirming today's breakout candle to set our short and midterm direction so the near-term bias is fairly well defined at this point so we need to stay flexible in our outlook and keep reassessing as the market develops First, let's compare what Daniel shared in Trading Lab yesterday We'll review how the market played out against our predicted scenarios.
The full analysis is exclusive to Trading Lab members only But in this video I'll still cover five key points for you I'll keep it brief and cover just the key points, starting with number one. I was focusing on this candle here, and yesterday I highlighted this price level. This candle has broken out above the recent swing high.
So the current trend is bullish, meaning we stay long biased. Daniel explained this, and also noted this candle broke out above the recent swing high.
and this candle is strong enough to also be read as an FVG here so this is a fairly strong breakout candle worth watching closely so we can consider using this level as a base for buy entries going forward on the other hand this breakout candle pushed above the prior high confirming upside but the sell setup forming from that recent high is also worth watching closely the initial sell line was forming with decent strength there so with strong buyers and strong sellers now locked in a standoff here we must seriously consider a shift into a sideways range I also mentioned that if the uptrend continues from here, there is still upside potential.
We'd use this candle as our base to add long positions. targeting the next higher high with a bullish breakout scenario also watch for a sideways consolidation range as a bearish scenario when the shift is confirmed, watch for the sell setup entry candle here if price is strongly rejected here again, expect renewed selling so we need to stay cautious as further downside remains likely after that During yesterday's live stream, Daniel called this move as it developed.
but the follow-through confirmed the bearish reversal signal it reversed and started dropping right here from that candle onward because this lines up with the entry trigger zone we noted earlier that setup makes it even easier for price to push lower, forming a clear strong reversal candle then it reversed, and in the London session it formed a low before the New York session the market broke above the recent high and pushed further upward from there
the bullish scenario played out perfectly, with the London session low as the base a clean 70 dollar move, roughly 705 pips to the recent high, exactly as the scenario predicted After that surge, price has continued pushing higher from this level. Momentum is relatively weak, with a mild decline continuing now. Also, today's content shared exclusively for Trading Lab members begins with the following.
Having a clear pivot for shifting your bias is key in this market. The Tokyo session ahead We're at a key turning point for both mid and short term direction. You need a clear bias-shift trigger in mind.
Currently, as Daniel mentioned at the start, the bias is bullish. Daniel explains the price action behind the bullish bias. I also covered the specific conditions for switching to a bearish bias.
I also go over the price action and detailed breakdown up to this point. I cover a full recap of the prior day's price action and market conditions. I'll cover the specific target rate and how to calculate the upside price goal.
Today's full breakdown is exclusively for Trading Lab members. Right now, gold is bullish. The Tokyo session is a key inflection point. That wraps up today's broadcast. Thanks for watching!