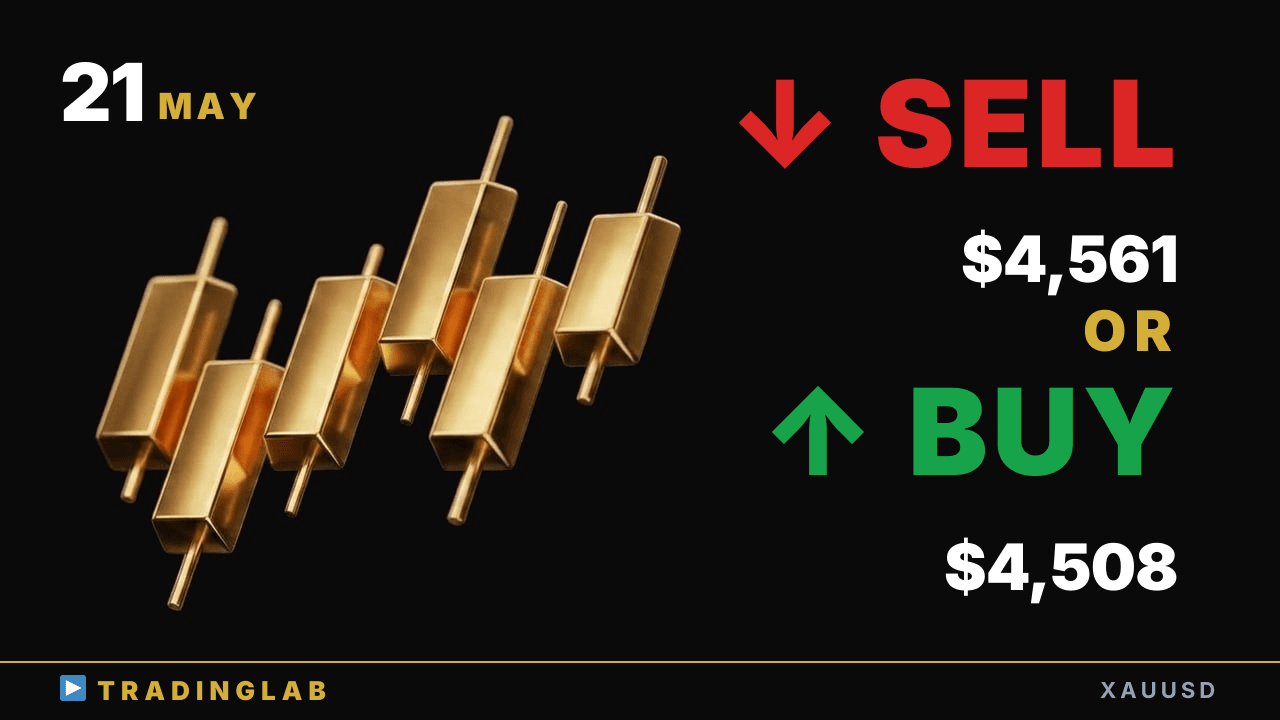
Gold hit the $4,500 measured move target this week and is now consolidating near $4,508 support. Daniel breaks down whether a higher low is building for a bullish continuation or if the range expands further. Key resistance to watch sits at $4,561 — a clean break there changes the picture. Short-term bias is cautiously bullish, but the direction isn't confirmed yet.
Gold at $4,508 support — higher low forming or range break? | XAUUSD May 21
 Watch on YouTube ↗
Key levels in this analysis
| Resistance | 4,561 |
|---|---|
| Support | 4,508 |
Summary
Video transcript
I'm Daniel, an 8-year pro prop trader helping beginners master FX trading. I run Trading Lab, a community built to help you profit with FX. Check the description below this video for full details.
Today, Daniel covers gold technical analysis shared in Trading Lab. I'll walk you through today's analysis and key insights. Right now I have the 1H chart up, starting with the short term view.
For the short term, I'm leaning bullish on gold right now. Let me explain why — looking back at how the market has been developing lately. The recent high of $4,508 was reached right as the New York session opened yesterday.
With the first key level confirmed, price has broken through resistance An upward trend is now forming after the trend reversal We've built a short setup from the recent high and pushed lower. but first, I shared the exact entry level with Trading Lab members. forming a base, setting up a buy, then triggering a long entry so that kind of price action is currently playing out on the chart I see a strong likelihood of higher lows forming and an uptrend continuing So that was my bullish outlook explained.
Now let me dig deeper into it. As always, let's begin with the Tokyo session and work through the detailed analysis. It's been a while since my last update, so let's dive right in.
I've been away, and since my last stream, let's revisit the scenario. Let's compare what actually played out, starting with the Tokyo session. The first thing I was watching for was a downside break of this silver Doji candle.
So this candle here was clearly acting as the confirmed breakout candle in this move. So with this candle breaking out, the measured move would be calculated by applying the same candle's range downward from its low point and that measured move target lands right around the 4500 dollar level. So at the weekly close, the 4500 dollar measured move target was confirmed.
So from the weekly open it was very likely price would come to test that level and I also mentioned that in the longer term, price could potentially fall below the 4500 dollar level I also discussed how the probability of price dropping below the 4500 dollar level remains quite high. I had also outlined a bullish scenario using that level as a key support low. Today's scenario targets a deep pullback near the 4500 level.
If the first cooldown of the new week confirms, this becomes a key trigger. The Dai-in candle signals a selling climax pattern here. So the result confirmed exactly what we discussed before.
Looking back, since today is Thursday, let's review how the market played out from Monday. This candle reached the major measured move target of 4,500 dollars. It reached the target, then formed a bullish setup right at that level.
The next candle did push the high slightly higher, updating the peak. It broke out successfully, but the follow-through failed. So the follow-through stalled, and this candle confirms that rejection.
A rejecting candle has formed, and price has now reached the measured move target. The bullish setup has been invalidated, and direction remains unclear. Price action is consolidating sideways, centered around this doji candle.
So we're currently stuck in a ranging market condition. We also need to watch for temporary spikes. So this red line marks exactly where our previous livestream left off on the chart.
For Trading Lab members, Daniel covered these key chart points in detail. The full detailed breakdown is exclusive to Trading Lab members. But I can at least share the key points here today.
Let me start by focusing on the two weekly candles and the horizontal range. In my previous stream, I was discussing this range — specifically which candles define it. So this candle and this candle here define the upper boundary of the range.
We assumed a sideways range with this level acting as the lower boundary, with two strategies. We shared two scenarios: which direction would this sideways range break out first. If price breaks out cleanly, we wait for the pullback to enter.
That's the breakout pullback strategy scenario, and the other one is one scenario is a double bottom reversal forming around this recent swing low for Trading Lab members, I had also shared these two scenarios at the end of last week as a market recap, we saw a reversal candle form, followed by a sell entry from that candle setup failures: short entry triggers, short target lows, and long entries and examples of setups you should skip or avoid trading
resulting in a temporary breakout above the sideways range from that entry but the pullback never materialized, causing the overall range to expand wider so price was consolidating sideways within a ranging market structure either way, what matters is the final outcome of this price action the price broke down out of this consolidation range, then pushed above the recent high and now the trend has shifted bullish, with a sell setup forming here a
fairly strong sell setup did form, but price pulled back down right now price is in the process of testing a higher low formation on the chart my current bias remains exactly as shared earlier with Trading Lab members today from this reversal zone, I'm watching for a buy setup here so I'm maintaining a bullish bias, including the possibility that price could push up and break the recent high For Trading Lab members, I cover key price zones and trade
setups in more detail. Today I'm sharing a more detailed breakdown for Trading Lab members. There are price moves to anticipate from current action. We also covered gold — today the short term bias is bullish. That wraps up today's broadcast for now.