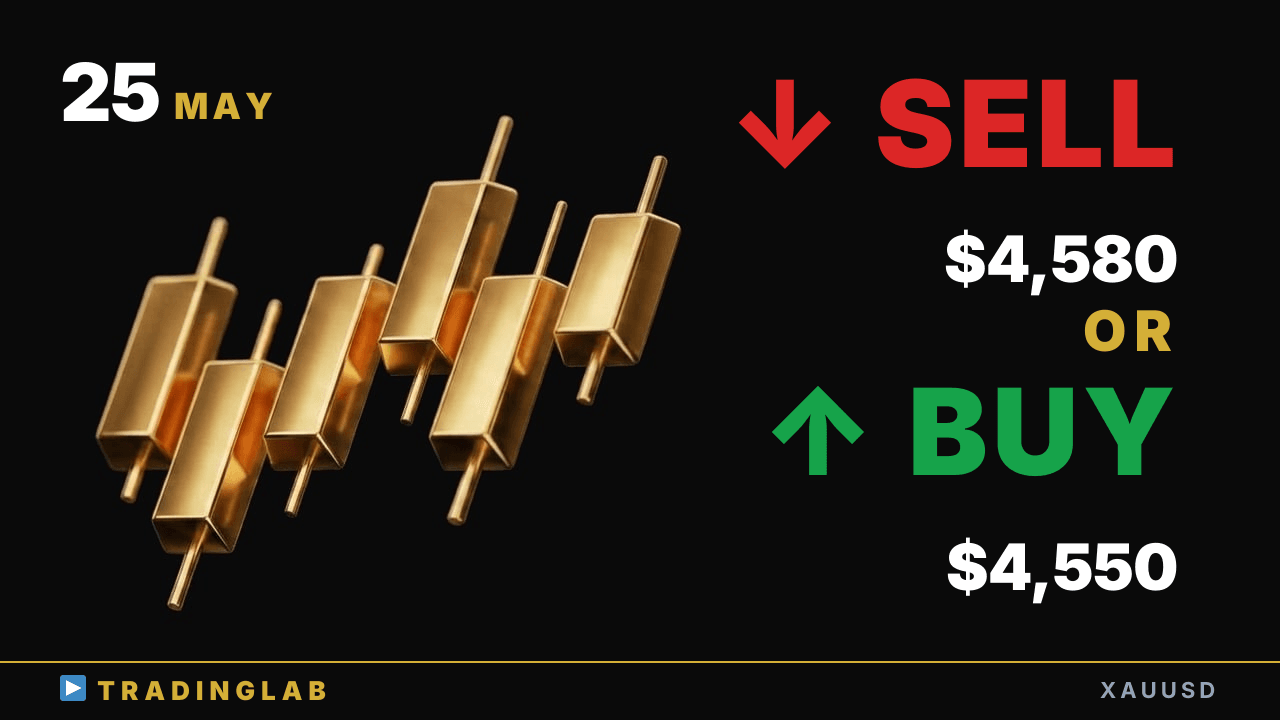
Gold gapped up this week and logged a ~$89 move off the London session low, but price is now stuck inside a consolidation range with $4,580–$4,606 capping the upside and $4,506–$4,550 defining support below. Directional bias stays unclear until a clean breakout — and confirmed pullback — happens on the higher timeframe. Daniel breaks down the inside-bar setup forming this weekend and the exact structural triggers that would flip the bias bearish. Watch how price reacts at the range boundaries to position for the next meaningful leg.
Gold in Consolidation Range — Breakout to $4,606 or Back to $4,506? | May 25
 Watch on YouTube ↗
Key levels in this analysis
| Resistance | 4,606 · 4,580 |
|---|---|
| Support | 4,550 · 4,506 |
Summary
Video transcript
Hi, I'm Daniel, a professional prop trader with 8 years of experience, helping beginners learn to trade FX profitably at Trading Lab. I run Trading Lab — check the description for details. Today's gold technical analysis includes some content shared inside Trading Lab.
I'm showing the 1-hour chart right now, and as always, I'll cover the short-term outlook first. As I mentioned in the previous outlook, price held above the key level, forming a buy setup and pushing into an upswing with a monthly gap-up this week. Including this area, price has shifted to the upside, updating the most recent swing high, so under corrective wave theory, we now have an uptrend structure, giving us a bullish bias.
So this first corrective pullback against the initial rally came in quite deep, which is exactly the kind of price structure we need to be aware of going forward. Now, with the short-term outlook covered, let's move into the full detailed analysis starting from the higher timeframe view, as we always do. For gold, the first thing we need to understand is this large sideways consolidation range that's currently forming on the chart.
We can see a clear sideways consolidation range has formed, with this recent high acting as the upper boundary and this low defining the lower boundary. So for our analysis, the basic outlook is that directional bias will only become clear once price breaks out of this consolidation range, and right now that direction remains uncertain. More recently, price has formed a small Doji candlestick pattern here, showing indecision between buyers and sellers.
As a result, the weekend candle has formed as an inside bar, sitting completely within the prior candle's range. So we have a range forming within a range. Typically in theory, a range tends to break out in the direction of the prevailing trend, which is the standard expectation here.
But looking back, gold's trend has become quite ambiguous overall. On the ultra long term timeframe, we are clearly in an uptrend, but the near term picture is less clear. We can read the current price action as a corrective phase, though examining each individual wave structure adds more nuance to that view.
Recently we've seen a downside breakout, so this could be read as a downtrend — either way, the directional bias remains very difficult to read right now. So at minimum, directional clarity on gold will only emerge once we see a clean breakout from this range, followed by a confirmed pullback. Rather than chasing new highs or lows on the shorter timeframes, the priority here is to trade within this established range.
So building a strategy that focuses on trading within this internal range is the right approach. Alright, that covers the cooling phase, so now let's move on and analyze the 1H chart timeframe together. The full audio breakdown is exclusive to Trading Lab members, but let me quickly recap what Daniel shared last weekend and how the market actually played out since then.
Last weekend, Daniel explained to Trading Lab members that price had broken out above the most recent swing high, confirming that the overall trend was clearly bullish and pointing higher. The setup Daniel was watching for was a pullback from the September high, with the live stream happening right around this point on the chart. Daniel was discussing a strategy of entering long positions by targeting the end of the corrective move and the swing low completion.
Also, shifting your directional bias at the right moment is critical. As Daniel mentioned, a Doji candle had just formed right before this move. So until that breakout occurred, the overall directional bias was fragile and prone to breaking down.
So while the bias was bullish, Daniel stressed the importance of always knowing your exact bearish reversal trigger points. The first bearish trigger is price breaking below the 9th swing low. The second condition is a clear lower high forming from this most recent peak, confirming a shift in structure.
When this pattern forms, we need to shift our directional bias. A confirmed breakout below this swing low is the trigger that flips us into a clear downtrend. So we need to shift our directional bias, and before that happens, we'll naturally see lower highs forming first.
So we need to factor in that breakout and shift our directional bias accordingly. Looking back at how last week's market actually played out in the end, After the Tokyo session, the London session candles were completely overlapping, lacking any clear direction, but heading into the London close, a clear buy setup began forming. This price action directly contradicted and negated the buy setup that formed during the prior London session.
The price broke upward with a strong gap, and this candle pattern confirmed the end of the corrective swing while fully respecting and holding that candle's support level. So this played out exactly as the Trading Lab scenario predicted. Measuring from the London session low to the most recent high, the total move was approximately 89 dollars.
That works out to roughly 896 pips of upside movement, and now let's take a look at where the gap is sitting on the chart. Since the NY session close left a gap in price action, live trading would have been difficult, but the market did play out exactly according to the scenario we had mapped out. In today's Trading Lab stream, with the one-hour level as our focus, price gapped up at open, but there are key points to watch in the current price action.
I covered that analysis, and if price forms a bottom and the uptrend resumes, the key factor to watch is exactly where that bottom structure forms on the chart. When you combine that with the price action leading up to it, there are key points to watch, which is what I covered today. My base bias for today is bullish, and that wraps up today's gold market analysis from Daniel.