Gold is consolidating inside a sideways range with 4,764 acting as the upper limit and 4,648 as the floor. Daniel breaks down yesterday's $77 bullish surge, the doji candle stalling at resistance, and why a clear higher low or double bottom near support is needed before the next clean long entry. Watch these two levels closely for the breakout signal heading into tomorrow.
Gold Stuck at 4,764 Range Cap — Breakout or Stay Rangebound? May 13
 Watch on YouTube ↗
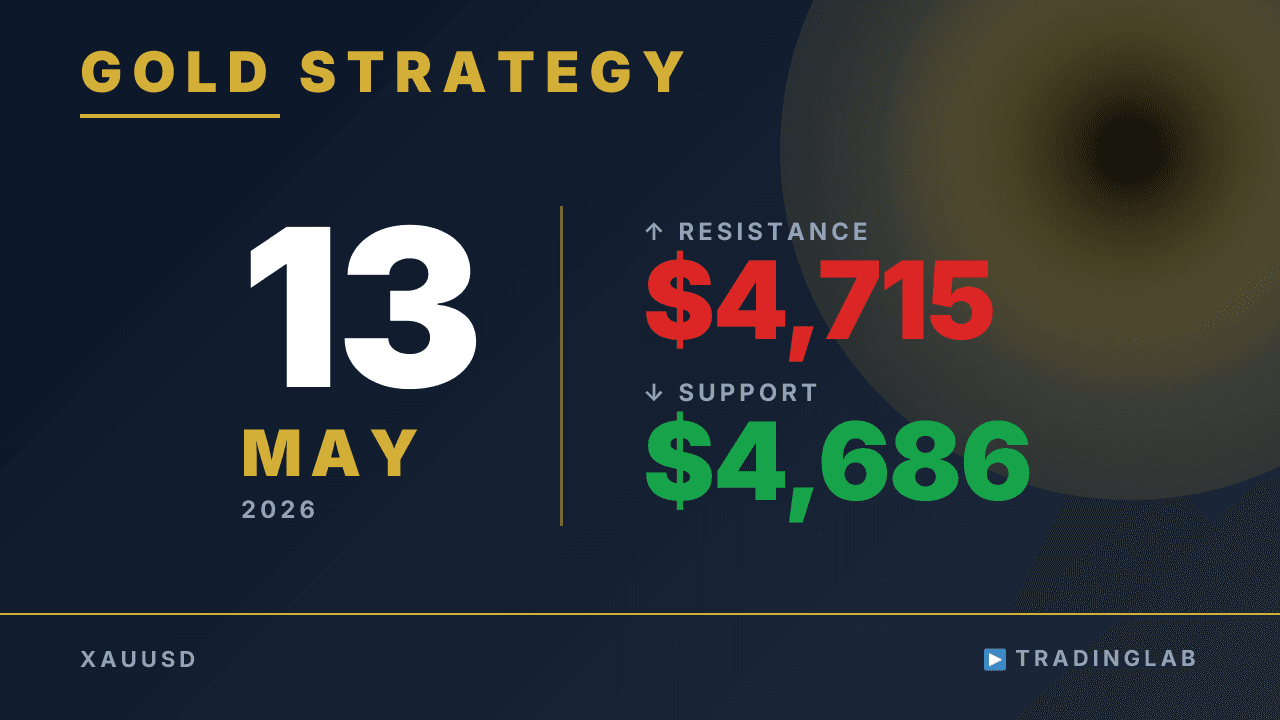
Key levels in this analysis
| Resistance | 4,746 · 4,715 |
|---|---|
| Support | 4,686 · 4,675 |
Summary
Video transcript
Hi, I'm Daniel, an 8-year pro prop trader helping beginners master trading. I run a community called Trading Lab for FX traders. For more details, check the description box below this video.
Today I'll cover gold technical analysis from Trading Lab I'll blend in some of that Trading Lab content as we go through this. Here's the 1H chart, sharing near term outlook as usual. Right now price is consolidating in a sideways range on the chart.
A breakout from this range should set the direction. However, for this video I must conclude with either a bullish or bearish bias. So I will base my conclusion on the most recent trend analysis.
It has broken out above the previous high, signaling an uptrend. So the trend is bullish, and my outlook stays upward. Let's get started with today's analysis, just like we always do.
I'll walk you through a detailed breakdown of yesterday's gold analysis. Yesterday's pullback was confirmed by a major candlestick on the daily timeframe. The scenario I had outlined was centered on these two candles here.
This range here is acting as support and resistance, forming a sideways range. The key focus right now is whether price can break out of this range.
whether price can break out above the range with a solid candle body close the final cooling candle body is sitting right inside this range, from 4764 dollars watching closely whether the price will stay contained within the 4648 dollar range and as a result price formed a doji candle staying within the range so ultimately yesterday was still a ranging market with a widening range and in the short term, we're also still seeing continued range conditions so conditions still favor range-bound price action here the scenario remains unchanged, so let's now move to the 1-hour chart review I'll review what was shared exclusively for Trading Lab members yesterday.
The five key points I'll cover next form the core of today's analysis. This is exclusive Trading Lab member content with full details inside. Check the video description link to join Trading Lab for more.
Please check the steps to join and let's get started. From a volatility standpoint, the probability of reaching it stays low. In theory, the broader trend still targets the 5015 dollar level overall.
However, the cooling pattern aligns with the sideways range here. Today's high and the realistic target is the upper limit of the sideways range. The $4,764 level was mentioned as the most realistic and appropriate target for this move.
The move we're referencing here is a reversal momentum shift. This swing high formed here marks a key processing momentum shift point. Because momentum is strong, watch for a clear higher low or a double bottom.
Look for a clear bounce off support, or alternatively a double bottom pattern forming here. Without that move, entering a long trade becomes very difficult. As usual, let me walk through yesterday's market price action together.
We'll cover the long entry, take profit, reversal, and swing formation. I cover the full sequence in detail, right up to the reversal signal. My actual trade history using the 5-minute chart is shared in Trading Lab.
On the 5-minute chart I watch these key levels to enter trades. So that is exactly what I shared with you in yesterday's live stream analysis. And what I covered was the long entry around this area right here.
And I explained taking profit on that long trade up to this point. Yesterday's stream covered the 1-hour timeframe FVG right here on the chart. A candle has formed sweeping the FVG around this key level.
I was recording this video analysis, though as I mentioned just before, here the momentum on that swing was quite strong at that point bulls were hesitating to commit to long positions yesterday's price action tested this FVG zone for a second time as I analyzed but the breakout attempt ultimately failed to confirm a valid entry signal The failure came from this Doji candle forming right at that level. After this, we see a strong key level forming on the chart.
but the previous candle forms an inside bar pattern within that range resulting in a fully overlapping formation and ultimately a layered setup breaking down through the range and pushing lower from there right at the range boundary and along this long-watched channel line on the chart it clearly formed a reversal candle right there, then paused and shifted direction roughly 77 dollars, about 7749 pips, surging that distance in just 4 hours, very
powerful forming a strong bullish swing, with a slight overshoot above resistance after reversing, price is now consolidating in a small sideways range again price has dipped slightly below the initial FVG level on the chart going long here was clearly the more efficient trade entry so overall the price action played out as expected in our scenario Today's Trading Lab content focuses on the sideways range forming. The two key candles that define this sideways range and the trend shift.
Let me walk through the full sequence of price action and market movement. I also covered the entry trigger points in detail. That wraps up today's gold market analysis.