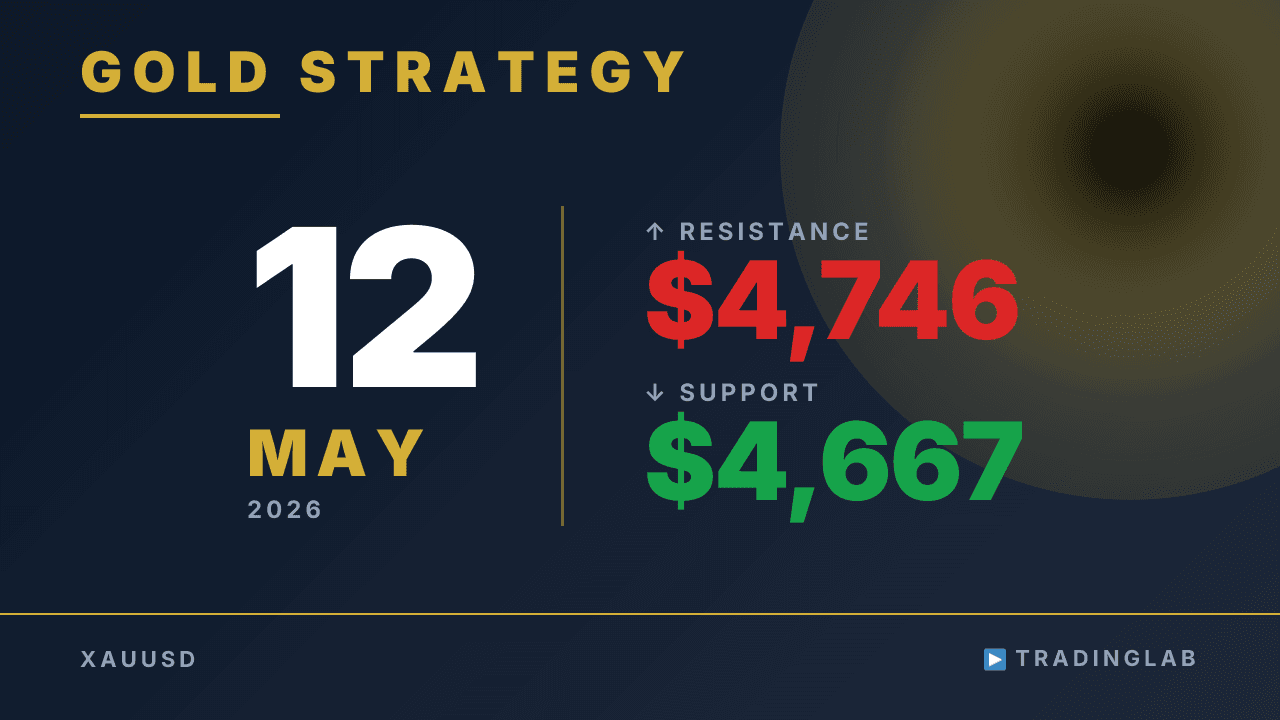
Gold confirmed a long lower wick close and swept the FVG near the major low, with price then rallying ~$98 in just 4 hours to the channel top. Daniel breaks down the double-range structure, key support at 4,667–4,670, and resistance at 4,746–4,764. Two scenarios are on the table: a bullish continuation inside the cooling range or a head-and-shoulders breakdown targeting lower. Watch the 4,670 support zone and the channel top for the next directional clue.
Gold Tests Channel Top After $98 Sweep — May 12 XAUUSD Outlook
 Watch on YouTube ↗
Key levels in this analysis
| Resistance | 4,764 · 4,746 |
|---|---|
| Support | 4,670 · 4,667 · 4,648 |
Summary
Video transcript
Hi, I'm Daniel, an 8-year pro prop trader helping beginners learn to trade. I run a trading community called Trading Lab. For more details check the description box below this video Today I'll cover gold technical analysis from Trading Lab I'll blend in some of that content as we go, starting with the 1H I'm displaying the chart now, starting with the short term view For today as well, I'm still maintaining a bullish outlook overall My core plan is to look for long trade setups as they form.
So that's my primary trade plan. Now let me share the short term outlook first. I'll walk through this step by step as always, so stay with me.
I'll use charts and visuals to walk through the details clearly. Gold closed the prior day with a relatively lower close on the daily. It confirmed with a long lower wick, suggesting reversals near lows.
The day before, Daniel had flagged exactly this market setup. It played out exactly as planned, sweeping the FVG around this major low. A long lower wick candle has now confirmed and closed on the daily chart.
This confirms the long lower wick close we were watching for at this level. These two candles, the pin bar and prior long lower wick, now form our key pivot zone. This setup naturally favors a range-bound double-range formation.
So we're forming a horizontal double range, and at this cooling level here, we'd naturally expect buyers to step in and provide support near the range low. As I mentioned recently, price has swept through the FVG zone. So the current move aligns with what I showed in my last video.
The big picture here still points to this major gray zone as key resistance. I mentioned the cooling range shown here is likely to test its upper boundary. This scenario avoiding a downside break makes it far more likely to play out.
The support confirmation makes this scenario feel even more realistic now. So the situation is becoming clearer, and we continue to watch the pullback. We're testing the top of this large cooling range, staying bullish overall.
That covers the cooling range analysis, now let's check the hourly watch points. Let me walk through yesterday's YouTube recording session for this analysis. A long upper wick candle, but the body is quite small.
I was recording this analysis video around this area. At that point I was streaming this for Trading Lab members. The content looks like this, though full details are for Trading Lab members only.
So I'll keep this brief and cover just the key points for today. For today's market, there are two key focal points to cover. I had shared these focal points with Trading Lab members.
The first is the 1H surveillance level, which I call the 1HSSL short position zone. This is the zone where stop loss orders tend to cluster, which I call 1HSSL. But this nearby reversal low, formed right at that key level, has now been tested twice.
After that retest plays out, we could see price push up to test the top of this channel. That swing formation is our first bullish scenario to watch for. The second scenario involves a downside break of this channel line.
This is the scenario where a breakout occurs from the prior day's formation. The left shoulder is slightly cut off, but this is a head and shoulders top. This central peak is the head, and this area forms the right shoulder.
That pullback low aligns with a major FVG on the 1H timeframe. So price was likely to pull back down toward that level in this scenario. If price breaks down through here, we target the measured since the target is close, day trading is the better approach I was explaining which timeframes you should be trading on We also review the previous day's market range and price action.
After the breakout, this channel line begins to take shape on the chart. By connecting these two points, we can draw the channel line. This is the trend channel line, formed right here on the chart.
For Trading Lab members, I covered the full swing process. Let me walk you through what actually happened after that — here are the results from the previous day's stream. And right on cue, price came back to retest that level a second time, just as the scenario predicted.
On the shorter timeframes, like the 15 or 30 minute charts, a double bottom formed. You could see a buy setup forming right here on the chart. And that buy setup pushed price right up to the channel top yesterday.
Price pushed into highs right around the NY open session. This swing has formed exactly as our scenario predicted. From the low of this setup, the price moved about 98 dollars.
That's 9809 pips reached in just 4 hours, making it a solid short trade. That was a strong performance overall on that trade. Also, today for Trading Lab members, I'll cover my long entry from the prior day.
We'll review the actual trade history together on the 5-minute chart. I'll walk through the key price levels I was watching on the chart. I covered the key levels and what setups I'm watching going forward.
I also mapped out the upside targets if the bullish trend continues. Today I walked you through what price levels to watch closely. I'm still leaning bullish overall, and that wraps up today's gold analysis.