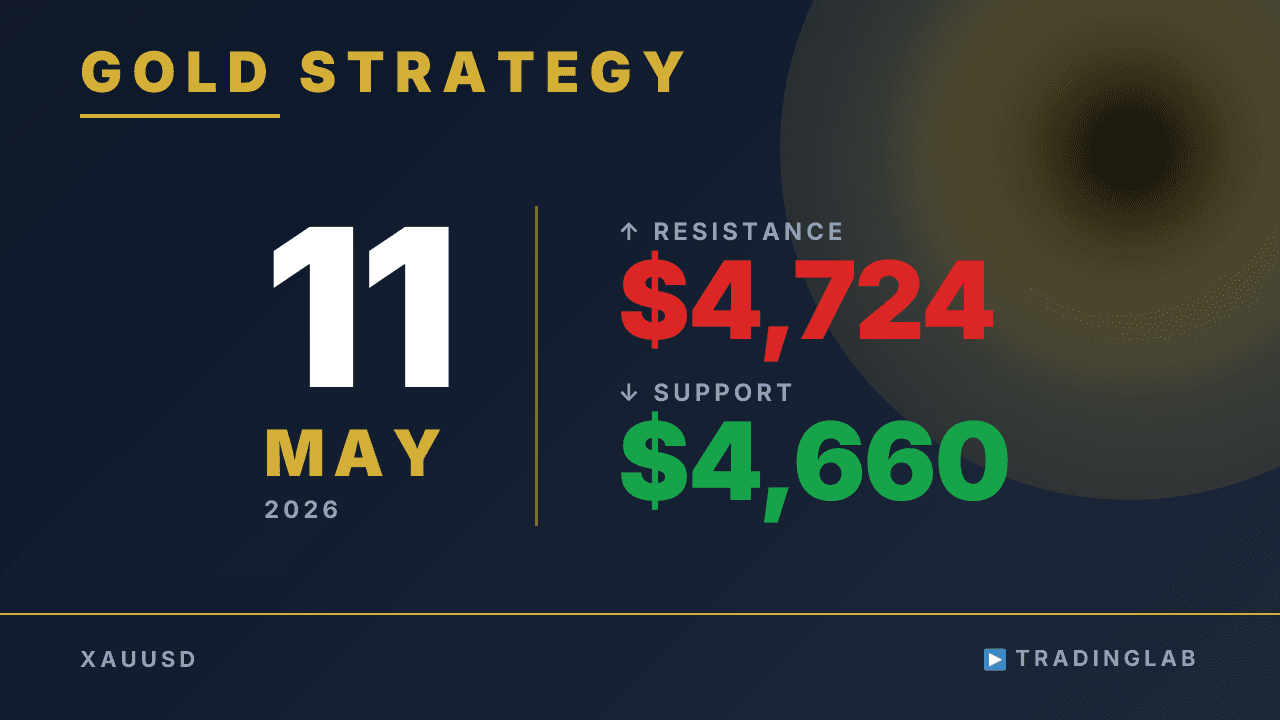
Gold is consolidating inside a descending channel after a ~$46 rally that invalidated a head-and-shoulders pattern. Daniel breaks down the key support zone at 4,660 (with 4,631 below) and resistance at 4,724, outlining two price scenarios to watch. A bullish reversal from the current range could target the upper boundary of the horizontal consolidation zone. Watch these levels closely heading into the new week.
Gold at Decision Zone: 4,660 Support vs 4,724 Resistance — May 11
 Watch on YouTube ↗
Key levels in this analysis
| Resistance | 4,724 |
|---|---|
| Support | 4,660 · 4,631 |
Summary
Video transcript
Hi, I'm Daniel, an 8-year pro prop trader helping beginners learn to trade. I run a community called Trading Lab for FX traders. For full details, check the description link below this video.
Today I'll cover gold technical analysis from Trading Lab. I'll be sharing some of that analysis content as we go, focusing on the 1H chart. Here I'm displaying the chart with my short-term outlook.
As I shared with Trading Lab members first, that is the current situation. The price action hasn't given us a clear directional bias yet. For the sake of video structure, I do need to commit to a directional bias.
So based on current price positioning, I'm leaning bullish on gold right now. Let's get started with today's detailed breakdown, beginning from the East session. So let's move on to gold — here's what confirmed at the East session last Friday.
This is typically a bearish signal — a pin bar with a bearish inside candle just before it. But given current conditions, this likely points to selling I had mentioned this signal would not function as valid confirming that signal has now been invalidated by the rejection so from here the basic expectation is that price will continue to move lower we should expect volatile price action around this key level one strong possibility centers around this major support zone as the key pivot sweeping through this FVG zone before reversing sharply
to the upside so that kind of price action is what Daniel is expecting here, with recent highs stepping lower each candle is heavily overlapping with very weak momentum there is still a strong chance of a full bullish reversal from here and if a full reversal does play out, we would expect price to follow the classic textbook pattern targeting the upper boundary of the consolidation range specifically the horizontal consolidation range I mentioned
the gray zone marks the horizontal consolidation range the upper boundary is likely to be tested if price reverses here so that's my current read on the market. now let's move on to the hourly watch list for the hourly watch list, let's go back and review what we covered last time at that red line, four key points were shared with Trading Lab The full breakdown is exclusive content for Trading Lab members only. But let me cover the key points here on YouTube quickly.
First, the cooling and temporary monitoring form a head and shoulders top pattern. Based on my experience, this pattern has a good chance of being invalidated. I was explaining that the pattern has a high probability of failing.
Now, if this head and shoulder top breaks out to the upside on the chart, even if it fakes out with a sideways range, it will ultimately push higher so a return to the uptrend is the most natural outcome here I had been discussing this during the weekend Tokyo session broadcast. Regarding the band, price is forming what looks like a bull flag pattern here.
Taking into account this head and shoulders top pattern here saying this pattern is likely to be invalidated, left shoulder, peak, right shoulder I was discussing that, and as usual, let's review the market moves since last time covering the buy setup formation and the subsequent uptrend that followed then that uptrend reversed direction as we moved into the Tokyo session market hours until price settled into a sideways consolidation range, I walked through Looking back, Thursday's market set up one clear buy entry here clearly forming a pullback structure for a potential buy setup Look closely at the body sizes of these three bearish candles here.
They appear to be gradually shrinking in size on the chart. At this level, it functioned as a rising wedge pattern. It very likely behaved as a classic wedge formation here.
The recent high breakout clearly signaled a strong bullish trend bias. It showed strong momentum, followed by a pullback. A clear sell setup was forming at this point too.
Looking back, this breakout here was a classic false move in hindsight. and then a classic fake setup pattern formed before reversing again after printing a new high, price moved into the London close and New York there was a clear and obvious sell setup at that session transition it formed a reversal high and then dropped sharply from there that reversal move was forming the right shoulder of the pattern from Friday's Tokyo session through the London market open the price action formed a blue channel, that's the recap
so far so, looking back at how the market developed heading into last weekend, it rallied sharply enough to invalidate that right shoulder, all within about 2 hours after rising roughly 46 dollars, or about 4661 pips, a clear sell setup has now formed forming two reversal points that define a clear channel line on the chart and price is currently moving and consolidating inside that channel so with this descending channel, a rally higher is expected
next so a return back to the prior trend remains the most likely outcome today I'll also share part of what I covered for Trading Lab members I'll walk you through the two key levels shaping today's market First, I checked the 1H chart, and now a flat, neutral bias is needed. So let me walk you through the specific price levels. I'll explain how to read price action and forecast next moves.
As always, let's review how the market moved since last weekend. More detailed price action breakdowns are for Trading Lab. For today's session, Daniel has outlined two possible price scenarios to watch. The full breakdown of both scenarios is covered in Trading Lab. That's all for today's gold update.