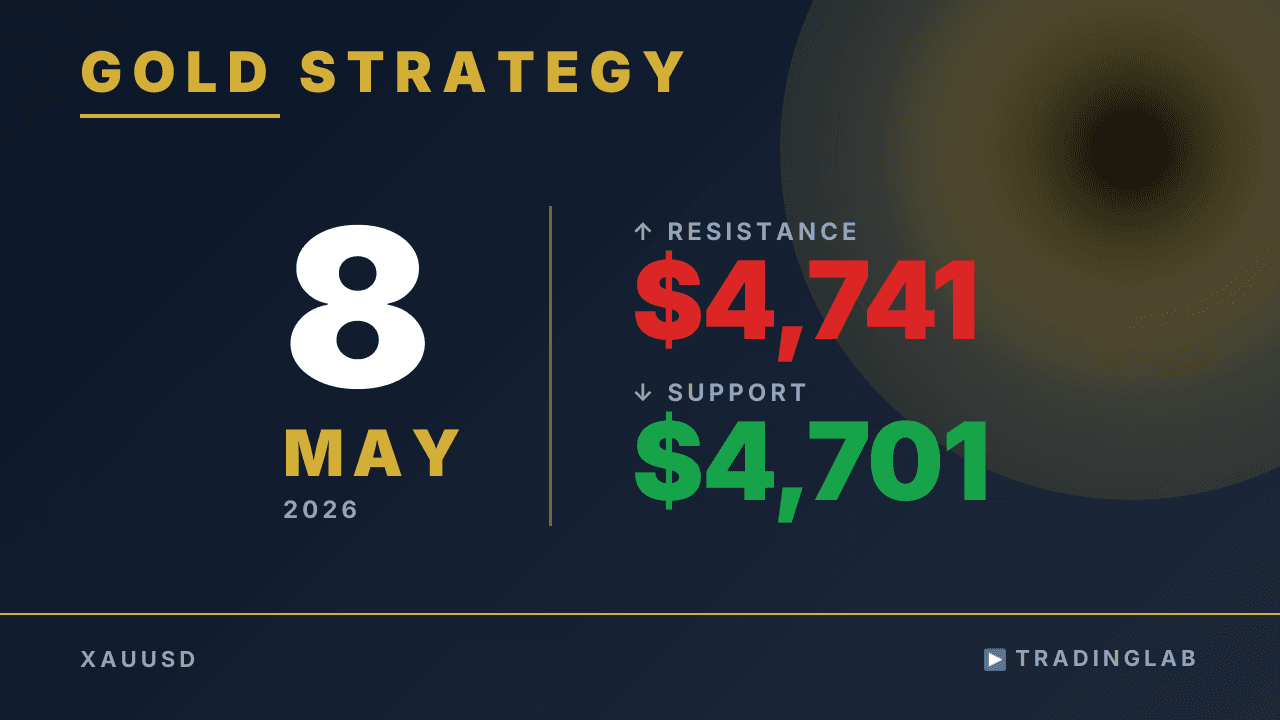
Daniel breaks down gold's May 8 price action on the daily and H1 charts. Yesterday's bearish pin bar is dismissed as a reversal signal in context — the bias stays bullish with a measured-move target of $4,786. Support sits at 4,701–4,690 and resistance at 4,741, then 4,786. Watch these zones for pullback buying setups heading into the next session.
Gold Stays Bullish — 4,786 Target & Key Levels | May 8
 Watch on YouTube ↗
Key levels in this analysis
| Resistance | 4,786 · 4,741 |
|---|---|
| Support | 4,701 · 4,690 |
Summary
Video transcript
Hi, I am Daniel, a professional prop trader with eight years of experience. I run the TradingLab community, helping beginners learn to trade. Please check the video description for more details.
Today, I will share my gold technical analysis, including insights from our community. Looking at the one-hour chart, I remain bullish for the short term. I will explain the daily chart soon, but I expect a pullback to the daily support level before the uptrend resumes.
Let's start with the daily chart. Regarding the daily gold chart, it closed as a bearish pin bar yesterday. Usually, this acts as a reversal signal, but given the current context, it is unlikely to function that way.
Therefore, I am not considering a short strategy on the daily timeframe based on this candle. I have explained why this signal is unreliable in the current market to our community members several times. Understanding the context of where this candle formed is crucial, so please dig deeper into that.
That covers the daily chart, so let's move on to the one-hour timeframe. The last update was when this large bullish candle formed. I shared six points with the community.
Since the details are for members only, I will summarize them here. First, on the one-hour chart, the uptrend could reach four thousand seven hundred eighty-six dollars, based on measured moves. Second, the daily chart remains bullish; since yesterday's pin bar wasn't confirmed and the previous candle was a large bullish one, I am still looking for pullback buying.
Third, if you missed the long entry, the current market is highly correlated, so other assets might offer better setups. Fourth, you can trade on lower timeframes; even a small five-minute breakout is tradable in this strong trend. If you do, take profit based on that timeframe's price action to avoid being caught in higher timeframe adjustments.
Finally, I reviewed yesterday's market, covering the morning buy setup, measured move targets, and key high and low levels. I also re-explained the evaluation criteria for upward momentum for new members. As a result, the buy setup from the Tokyo session led to a strong uptrend that lasted until the New York market open.
Counting from the low of that setup, the price moved by... It rose by approximately seventy-nine dollars, or seven thousand nine hundred fifty-three pips. While the uptrend continued throughout the day, a clear reversal setup formed in the two hours around the New York market open.
This could have been taken as a sell signal. The New York market shifted to a short-term downtrend, broke below the Tokyo session low, and is now in a downtrend. That concludes the review of yesterday's update.
For today's community update, I shared two points: the outlook for the rest of the day and a review of yesterday. Regarding the outlook, I focused on the current chart pattern. While the theory suggests a downward breakout, I am skeptical about a full trend reversal. I explained this in detail. For today, I remain bullish. That is all for the gold update.