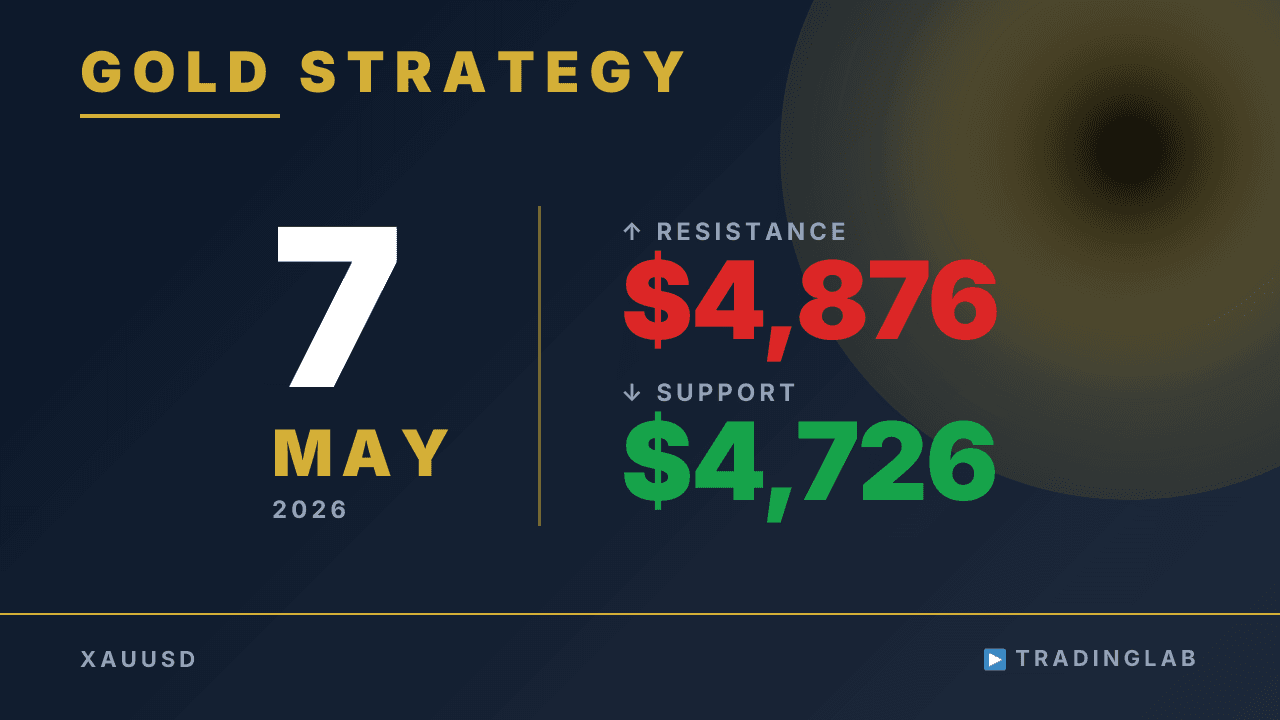
Gold surged ~$89 from yesterday's low, confirming the bullish scenario Daniel called in advance. On the daily chart, the failed bearish breakdown points toward a test of the upper gray-zone resistance near 4,876, while support sits at 4,726 and 4,707. Daniel breaks down the hourly structure, the sell setup that fizzled, and where pullback buying looks valid into the next session.
Gold Bullish Bias Holds — Testing Daily Range High | May 7
 Watch on YouTube ↗
Key levels in this analysis
| Resistance | 4,876 |
|---|---|
| Support | 4,726 · 4,707 |
Summary
Video transcript
Hello, I am Daniel, a professional prop trader with eight years of experience. I run the TradingLab community, aiming to help beginners become profitable traders. Check the description for details.
Today, I will analyze gold, including insights shared in our community. We are looking at the one-hour chart. As always, my short-term outlook remains bullish.
Yesterday's scenario played out exactly as planned, so there is no need to change our bias. Let's start with the daily chart. Gold formed a large bullish candle yesterday, breaking through short-term resistance as expected.
Regarding the current gold market environment, we need to consider two perspectives on the daily chart. First, from the bear's view, they broke below the bearish doji candle, triggering short positions. They were forced to stop loss.
The bearish doji had strong downward bias, and the breakout was solid. It was a strong sell signal, but the next day, a half-hearted buy setup formed a bullish candle. The following candle was a large bullish one with strong momentum.
This clear trend after a weak setup means that at least around here, they are being forced into a stop loss situation. Therefore, even if we try to create such a sell setup again, it is in a half-hearted area. where it is psychologically difficult to enter a new short position, which is how I interpret it.
Therefore, for example, today, even if it reverses into a bearish candle and forms a sell setup while leaving the candle itself, I do not really think it will lead to a development where it falls below the low. On the other hand, how do the bulls think? This large bullish candle likely provided the strong upward momentum that was missing in the previous half-hearted buy setup.
Therefore, bulls have likely switched to a situation where they want to actively consider pullback buying even for short-term trades. So, in the sense that it won't stop rising immediately, both bulls and bears seem to have a consensus. Therefore, I think it is fine to have a development that tests the upper limit of this daily range shown in the gray zone.
Also, theoretically, the downward breakout of this gray zone was a failure, so in that case, it is common to test the upper limit, which I think is the most likely scenario for the daily chart. Now, based on this, I would like to confirm the one-hour chart. Looking back at yesterday's market development, let's start with the scenario I shared with the community members.
For community members, the detailed content is exclusive, so I cannot talk about it on YouTube, but I talked about four points. Specifically, I said that because a strong upward trend is being formed, we should first focus on long positions, and even if a sell setup is created, we should wait to short today. Second, as a strategy, we should enter on a pullback, but yesterday's delivery point is this red line.
Since one upward swing was continuing, we could have taken this short price range in the short term rather than a price adjustment. In such cases, there is a short-term adjustment price action pattern that I have explained many times to community members. I talked about the strategy of looking at such points or looking at chart patterns on a five-minute chart.
Also, regarding the progress of this upward swing, I mentioned that it is currently overshooting the measured move that can be calculated from the current upward trend shape. Therefore, at the one-hour level, I talked about the fact that a price adjustment could happen from now on. Finally, as always, I looked back at the previous day's market.
I reviewed the price movements of the series of flows. The rise after the buy setup was formed, and the reversal and the formation of a downward wedge on the short-term chart. In short, if you check such price movements where downward momentum is weakening on a five-minute chart, it is a downward wedge, so I reviewed such price movements.
As a result, the upward swing continued even after the delivery yesterday. The delivery point is here. After that, the upward swing continued with thrust ups for three consecutive hours.
If you follow the price movement inside this, there is one entry point at the one-hour level, but a buy setup was also firmly formed on the five-minute chart. In the middle of the London market, a sell setup was created, and a price adjustment occurred as expected. This creates a sell setup, but this did not become a good short entry point as expected, and it fell to the point where the stop loss orders of past short positions were staying at the one-hour level.
After that, a buy setup was created, and a buy setup was also created at the opening of the Tokyo market today. It is developing to raise the low and rise again. Thinking from this low of the previous day, If you count the numbers carefully, it has risen by about eighty-nine dollars, or eight thousand nine hundred and eighty-one pips, from this low to the recent high.
I think it was a development exactly as the scenario. Also, today, for community members, I explained the new target high based on the subsequent development and current price movement, including specific calculation methods. Furthermore, since many new community members have joined, I explained the evaluation criteria for upward momentum again for those people.
I often use the expression strong upward momentum in my explanation, and I explained what I evaluate as strength. Also, as always, I explained in detail the review of the market from the previous day to the present and my long entry point for gold today. Today, I will continue to be bullish. That is all for the gold delivery.