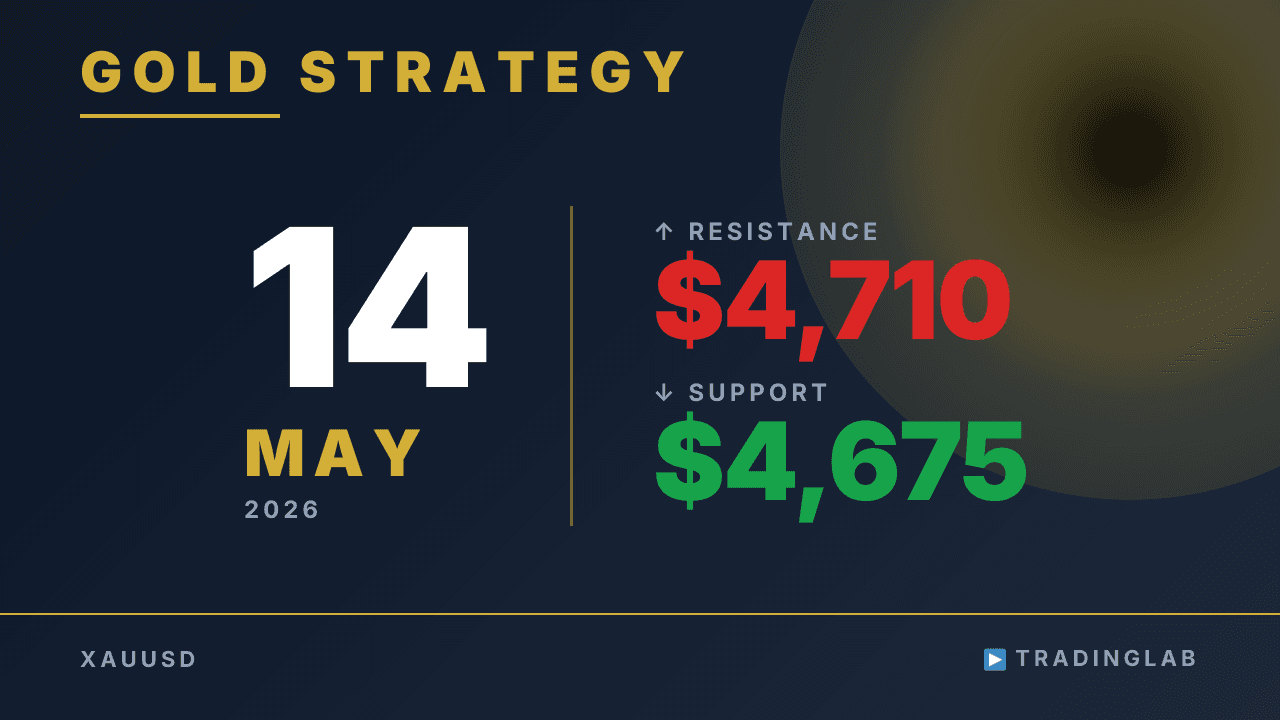
Gold printed a small bearish doji today, signaling a tightening consolidation range. Daniel breaks down the 4,675–4,710 decision zone and explains why waiting for a post-breakout pullback is the key entry approach right now. Bias stays cautiously bullish unless the current reversal structure gets negated. Watch these levels closely into the next session.
Gold Stuck in Range — Break 4,710 or Slide Back to 4,675? May 14
 Watch on YouTube ↗
Key levels in this analysis
| Resistance | 4,746 · 4,710 |
|---|---|
| Support | 4,675 · 4,648 |
Summary
Video transcript
Hey, I'm Daniel, an 8-year pro prop trader. I run a Trading Lab for aspiring FX traders. For details, check the description box below this video.
So today, let's dive into our gold technical analysis, mixing in some insights shared by our members. Right now I have the gold 1-hour chart displayed here. Starting with the short-term outlook, the recent price action is in a complete it's in a sideways range, so pinpointing a clear directional bias is but for the sake of this video, I'll still share my current market bias As long as this reversal holds and isn't negated, my base bias remains firmly bullish.
Now let me walk you through the detailed chart analysis as usual. I'd also like to cover the analysis of the previous day's price action. A large bearish candle didn't form — instead we saw a doji close on the bearish side today.
So the market tends to shift into a sideways range here. Regarding the cooling level, I noted a downward bias. And the result confirmed that bearish pressure was stronger.
So yesterday's candle was a small bearish doji right after the prior bearish candle. forming a range market inside that doji candle pattern. We can see this candle has formed with a bearish body closing lower.
This confirms the downward bias was indeed stronger here. So this result confirms and reinforces that bearish bias overall. Today a small bearish doji candle formed, showing volatility contraction from yesterday.
This suggests the market is essentially behaving like a range bound consolidation. Given this, let's now review the primary watch levels and timeframe. For the primary watch levels, I covered this in detail for Trading Lab members the previous day.
I walked through four key analysis points for Trading Lab members. The detailed breakdown is exclusive to Trading Lab members only. I can't share every detail here, but this covers the key points.
Right now, the market is ranging, using candles 7 and 8 as our key reference bars. For Trading Lab members, Daniel labeled these candles as bar 7 and bar 8. Daniel used these candles to define the boundaries of the current range.
In the short term, price action clearly lacks direction, showing no strong trend bias. Looking at recent price structure, the range appears to be expanding. So we've been trading within these two key reference candles on the shorter timeframe.
While managing around these levels, after a breakout, trade in the breakout direction. I had been explaining this is the right setup to enter a trade. The key point is the breakout direction, not the breakout itself.
The key lies in waiting for an unconfirmed candle that breaks out of the range. Rather than entering at the first sign of a breakout, wait for a clean break. Wait for the pullback after the breakout, then enter the trade.
The reason I explained this is to give context for today's Tokyo session market conditions. This period falls between the London session and the Tokyo session overlap. As you can see, the range highs and lows are briefly breaking out momentarily.
We're seeing price return back inside the range. So wait for a pullback before entering any trade. That was the explanation Daniel provided, with no clear reversal candle seen yet.
That was yesterday's market, reviewing the prior momentum shift. with barely any overlap inside these swing structures forming quite a strong bullish momentum within those swing structures So while this reversal candle is notable, one bar alone won't confirm a full trend shift. A stronger confirmation signal will be needed here.
So a breakout above the recent high was not expected at this point. So that was our read on the market, along with the usual minor price action. Yesterday's recap: we tracked the FVG sweep and followed through on that signal.
The failed break, the reversal, and the shift into a ranging market. I walked you through yesterday's price action and market recap. Looking at this, we could see a sideways range continue, with key price zones to watch.
As shown in the chart, we'll track these levels as future entry candle signals. These levels tend to attract strong attention, often leading to sharp bounces from them. I've covered this chart pattern in detail many times in my analysis.
In Trading Lab I explain the horizontal range concept At least the entry and stop loss levels can be clearly calculated. If I had to highlight just one key entry point from this setup, it would be this one. From the recent low up to the range ceiling, we captured at least around 40 dollars in movement.
That comes out to roughly 404 pips captured in total movement. Now, let's revisit the previous That wraps up today's Trading Lab broadcast content for members. For members, I'll cover the limited price patterns currently usable in this market.
I covered price action details within this range zone. I also covered what to avoid and what to target in the current market conditions. I covered all of that in full detail, including the current volatility across key assets.
The range is narrowing and flattening, making short term trades quite difficult. This is a market condition that appears reliably at least once every year. In this environment, knowing how to think and position yourself is critical.
Today's short term bias leans slightly to one side of the market. So unless this reversal candle gets negated, I'm staying bullish overall. That's the range holding — and that wraps up today's gold update.