Gold's daily candle broke below range support, but the 1H chart is showing a clear bullish reversal setup — Daniel breaks down both scenarios. Key levels: 4,494 downside target vs. 4,666 short-term upside target if the breakout holds. Learn how to read the price action signals that mark the early stages of a trend change. Watch for follow-through today — the setup is live and the price is already pushing new highs.
Gold Bullish Setup Confirmed — 4,666 Target in Play | Apr 30
 Watch on YouTube ↗
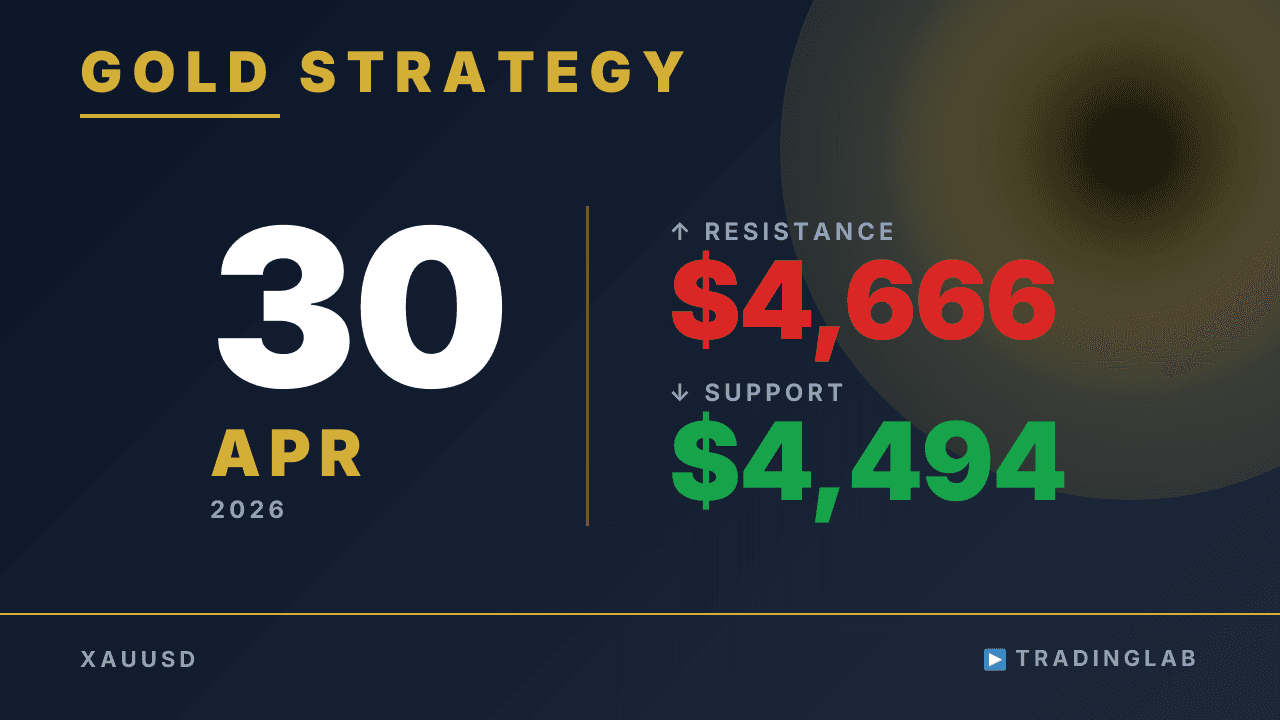
Key levels in this analysis
| Resistance | 4,666 |
|---|---|
| Support | 4,494 |
Summary
Video transcript
I'm Daniel, a professional prop trader with eight years of experience. I run the FX community, TradingLab, aiming to help beginners profit from trading. For more details, please check the description below this video.
Today, I'll be discussing the technical analysis of gold, incorporating some content shared within the community. I'm currently showing the one-hour chart. To give you a short-term perspective, my outlook for today is bullish.
This is because, about three hours ago, I shared with community members that the short-term trend had turned upwards. Looking at the internal swing movements, the bullish momentum is clearly strong. Therefore, today I'm looking for opportunities to go long.
I also explained that the recent price action has clearly formed a bullish setup. Although some time has passed and the market has moved, the price action is still unfolding according to the scenario. So, my outlook for today is bullish.
Let's proceed with a detailed analysis, starting with the daily chart as usual. For gold, the previous day's daily candle closed as a bearish candle. This confirmed bearish candle appears to have broken the lower range boundary for now.
Therefore, the focus for today's daily candle will be on whether there's follow-through movement downwards, or if the breakout below the range's lower boundary is a false signal, leading to a retest of the upper levels. These two scenarios are possible. If the bearish scenario plays out, what kind of daily candle shape would form?
First, a large bearish candle, right? If a large bearish candle forms, there's a possibility of a shift to a long-term downtrend. Even if it's not a large bearish candle, if the body of the candle remains bearish with little lower shadow, it suggests a situation where downward momentum is likely to continue for a while.
On the other hand, as we can see from the current movement, a rebound is generally more likely. If a rebound occurs, it would be a more natural progression to move upwards, even if it eventually turns into a downtrend. One scenario is a sweep of this FVG before declining.
Another possibility is a pullback to the lower boundary of the horizontal range formed by this recent bullish doji candle before declining. Both are conceivable. Therefore, in either case, it's more natural to confirm a rebound at the daily level.
Now, let's look at the one-hour timeframe. Regarding the one-hour timeframe, I sent out the following analysis to community members yesterday. The detailed explanation is exclusive content for community members, so I can only provide a brief overview.
Let's quickly recap the key points. First, I noted that we're watching whether this recent reversal candle acts as a bullish setup. If the price breaks above the high with its body, the bullish setup will be validated.
If the bullish setup is confirmed, I mentioned that we could test four thousand six hundred sixty-six dollars in the short term. Therefore, if this reversal candle breaks out downwards, the downtrend will continue, potentially reaching as low as four thousand four hundred ninety-four dollars in the short term. I also discussed the previous day's market analysis as usual, focusing on the shape of the bullish doji candle.
I mentioned that if it broke out downwards, we could initiate a short position, as the downtrend would continue. However, the downtrend continued strongly as expected. Furthermore, the scenario I mentioned earlier, where the bullish setup would be invalidated, played out.
Therefore, it would have been possible to initiate a short position at this breakout. Let's count the price range from the high formed after the video distribution to the recent low. Approximately seventy dollars, or seventy-fifty pips, moved in four hours – a good day trade range.
The market followed the scenario, just like last time. The market unfolded according to the scenario, similar to the previous time. Today's content for community members covers the basic strategy for today.
One is the bullish setup here, which can be entered above the high. This scenario has already played out, and the price is currently updating the high with strength. I also review the previous day's market, including entry points, as usual.
The focus of today's analysis is on how to interpret price action that leads to the start of a trend change. You can find a detailed explanation in the gold analysis room for community members. That concludes today's YouTube broadcast.