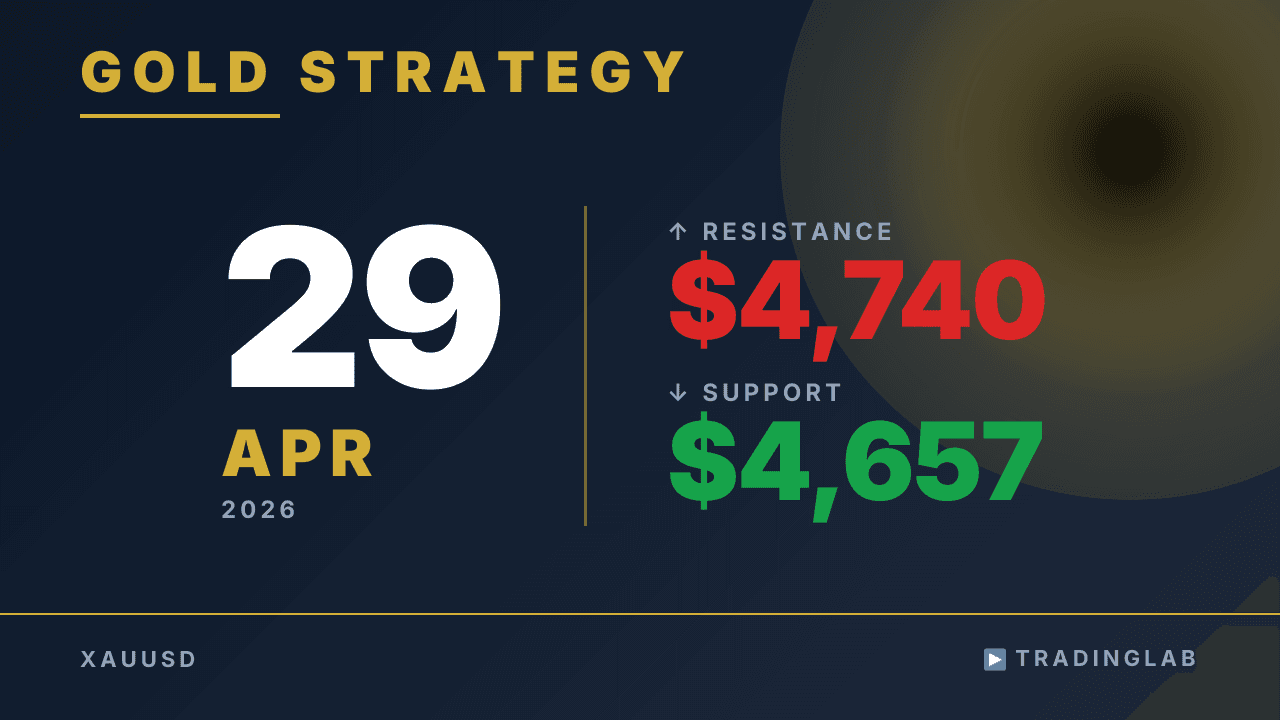
Gold cracked the $4,657 lower boundary of its $4,657–$4,740 sideways range, adding roughly $68 to the downside — largely as Daniel anticipated. The daily chart is now sitting at a key support zone, raising the possibility of a rebound or selling-climax candle before any continuation lower. On the 1H, the downtrend bias holds — but shorts are better suited to intraday/scalp timeframes given daily support nearby. Watch how today's daily candle closes: a clean bearish close keeps bears in control, while a wick reversal signals a potential bounce.
Gold breaks $4,657 support — what's next? Apr 29 review
 Watch on YouTube ↗
Key levels in this analysis
| Resistance | 4,740 |
|---|---|
| Support | 4,657 |
Summary
Video transcript
Hello, I'm Daniel, a prop trader with eight years of experience and full horsepower. I run the FX community, Trading Lab, aiming to help even beginners earn through trading. For more details, please check the description of this video.
Today, I'll be discussing the technical analysis of gold, including some content shared within the community. I'm currently displaying the one-hour chart. To give you a short-term perspective first, as the downtrend is clearly continuing, I'll be taking a bearish stance.
Now, as always, I'll provide a detailed explanation starting from the daily chart. The previous day's daily candle closed as a bearish candle, with a relatively large real body. The closing of yesterday's daily candle, as mentioned in the previous video and sent to community members, focused on whether the current horizontal line could be broken out.
This horizontal line formed a sideways range with an upper limit of $4740 and a lower limit of $4657. If today's daily candle closes as a bearish candle below the lower limit of this sideways range at $4657, it indicates strong downward momentum, making it highly likely to test the lower boundary of the larger recent sideways range. The larger recent sideways range is defined by this candle and this candle as reference candles.
It's the area indicated by the gray zone. Consequently, yesterday's daily candle tested this lower boundary. Therefore, we are currently at a daily support level, and a rebound is a concern at the daily level.
If we see a rebound today, or if today's daily candle closes as a selling climax candle, it could form a bearish candle like this. In such a case, the following day, after a slight dip at the open or no dip at all, a rebound is highly likely to occur. These are the points I'm focusing on for the daily chart.
Now, let's look at the one-hour chart for today's analysis. Reflecting on the market movement since the previous broadcast, yesterday's focus, as communicated to community members, was on which direction the breakout of this horizontal line would occur. For community members, I mentioned that if the bearish candle's horizontal line broke out downwards, the bearish outlook would continue.
If it attempted to go up, it would be a false breakout, and then it would turn upwards. If it broke out upwards, I mentioned that we could initiate a long position simultaneously with the upward breakout. The reason for this perspective was primarily the shape and position of this first bearish candle.
If this candle functioned as a selling climax, it would be at a point where it would touch the lower boundary of the descending trend channel, allowing for a potential upward rebound, thus constructing an bullish scenario. On the other hand, the next candle formed a bearish horizontal line. Since the downward momentum wasn't particularly strong, it was necessary to determine the breakout direction of this range.
Another perspective is possible. Besides viewing this first bearish candle as a selling climax, it can also be seen as a candle for the breakout of this range upwards. In this case, it would be a breakout of the support level upwards.
Considering this level has been tested at least once, twice, three times, and including this point, four times, a breakout with significant momentum was highly likely. Consequently, since the lower boundary of the horizontal line was broken out downwards, it was appropriate to act on the bearish scenario. Therefore, in terms of price movement since the previous broadcast, from the lower boundary of this horizontal line to the recent low, it has dropped by approximately $68, which is largely in line with the anticipated scenario.
Today's content for community members, while the detailed information is exclusive to them and cannot be fully disclosed here, will broadly cover three points. Today, we provided exclusive content for community members focusing on the shape of the candle that will determine the subsequent trend, and the target prices expected for each scenario – that is, the prices each scenario might reach. Additionally, this is done daily from Monday to Friday, covering a review of the previous day's market movements, including specific techniques on where to enter trades and where to calculate take profit.
Now, let's look at the real-time chart again. On the one-hour chart level, as I mentioned earlier regarding the candle that determines the subsequent trend, breaking out from this point was a key focus. As I initially stated, it has broken out downwards, so the downtrend is likely to continue.
On the other hand, regarding the daily chart, as I mentioned earlier, it has already reached a support price level, so a rebound is a concern. If considering a short position, it would be more suitable for intraday or shorter timeframes, like scalping, aligning with strategies that involve taking small, frequent profits. That concludes today's gold broadcast.
This candle and this candle are the reference candles for the larger sideways range. It's the area indicated by the gray zone. Consequently, yesterday's daily candle tested this lower boundary.
Therefore, we are currently at a daily support level, and a rebound is a concern at the daily level. If we see a rebound today, or if today's daily candle closes as a selling climax candle, it could form a bearish candle like this. In such a case, the following day, after a slight dip at the open or no dip at all, a rebound is highly likely to occur.
These are the points I'm focusing on for the daily chart. Now, let's look at the one-hour chart for today's analysis. Reflecting on the market movement since the previous broadcast, yesterday's focus, as communicated to community members, was on which direction the breakout of this horizontal line would occur.
For community members, I mentioned that if the bearish candle's horizontal line broke out downwards, the bearish outlook would continue. If it attempted to go up, it would be a false breakout, and then it would turn upwards. If it broke out upwards, I mentioned that we could initiate a long position simultaneously with the upward breakout.
The reason for this perspective was primarily the shape and position of this first bearish candle. If this candle functioned as a selling climax, it would be at a point where it would touch the lower boundary of the descending trend channel, allowing for a potential upward rebound, thus constructing an bullish scenario. On the other hand, the next candle formed a bearish horizontal line.
Since the downward momentum wasn't particularly strong, it was necessary to determine the breakout direction of this range. Another perspective is possible. Besides viewing this first bearish candle as a selling climax, it can also be seen as a candle for the breakout of this range upwards.
In this case, it would be a breakout of the support level upwards. Considering this level has been tested at least once, twice, three times, and including this point, four times, a breakout with significant momentum was highly likely. Consequently, since the lower boundary of the horizontal line was broken out downwards, it was appropriate to act on the bearish scenario.
Therefore, in terms of price movement since the previous broadcast, from the lower boundary of this horizontal line to the recent low, it has dropped by approximately $68, which is largely in line with the anticipated scenario. Today's content for community members, while the detailed information is exclusive to them and cannot be fully disclosed here, will broadly cover three points. Today, we provided exclusive content for community members focusing on the shape of the candle that will determine the subsequent trend, and the target prices expected for each scenario – that is, the prices each scenario might reach.
Additionally, this is done daily from Monday to Friday, covering a review of the previous day's market movements, including specific techniques on where to enter trades and where to calculate take profit. Now, let's look at the real-time chart again. On the one-hour chart level, as I mentioned earlier regarding the candle that determines the subsequent trend, breaking out from this point was a key focus.
As I initially stated, it has broken out downwards, so the downtrend is likely to continue. On the other hand, regarding the daily chart, as I mentioned earlier, it has already reached a support price level, so a rebound is a concern. If considering a short position, it would be more suitable for intraday or shorter timeframes, like scalping, aligning with strategies that involve taking small, frequent profits. That concludes today's gold broadcast.