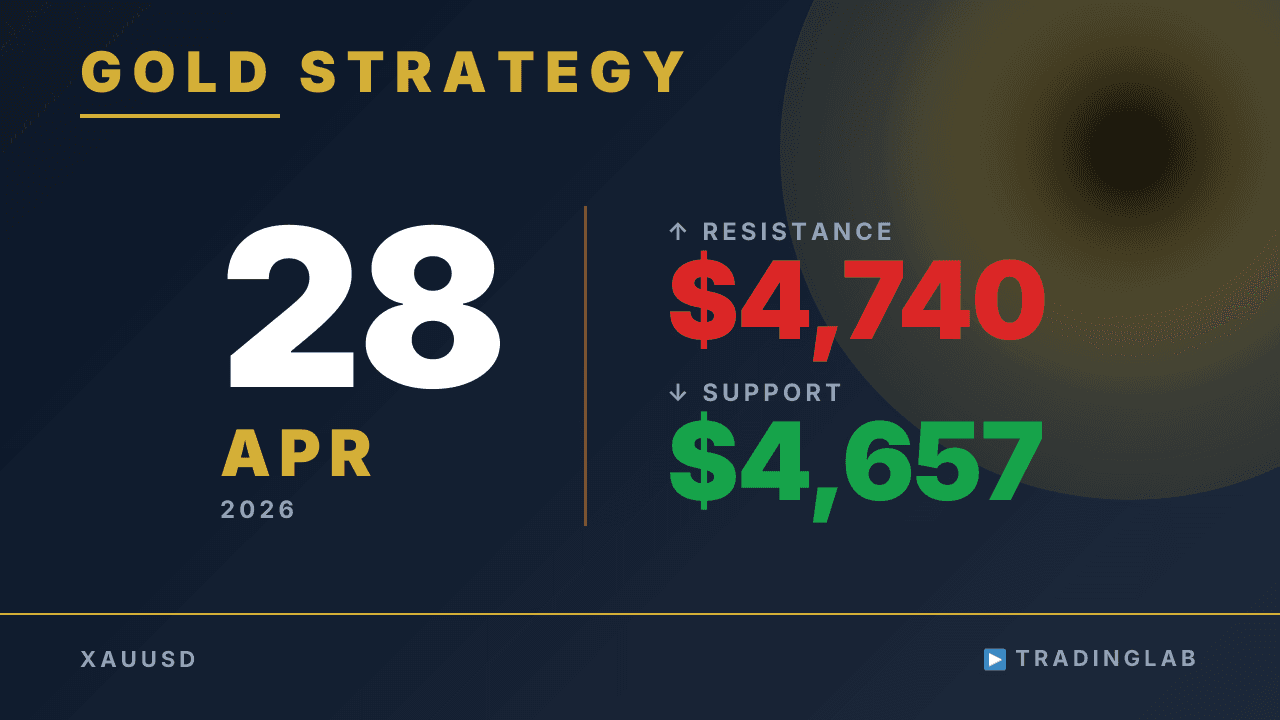
Gold closed inside the $4,657–$4,740 range but printed a strong bearish candle body, signaling the short-term downtrend is still in play. Daniel breaks down the H1 sell setup that dropped ~$62 and explains why bulls are struggling to reclaim higher ground. Key levels to watch: $4,740 resistance and $4,657 support heading into tomorrow's session.
Gold Breaks $4,657 Support — Bearish Setup Confirmed | Apr 28
 Watch on YouTube ↗
Key levels in this analysis
| Resistance | 4,740 |
|---|---|
| Support | 4,657 |
Summary
Video transcript
Hi everyone, Daniel here, an active prop trader for eight years. My goal is to enable even beginners to profit from trading. I manage the TradingLab community.
For more information, please refer to the video description below. Today, we'll delve into gold's technical analysis, sharing some insights from our community. I'm displaying the one-hour chart.
From a short-term viewpoint, if the body of this bearish candle closes below the low of the preceding doji, we'll adopt a bearish stance. Let's move on to the daily chart for a detailed explanation. First, we need to review the overall market environment.
I apologize for the repetitive explanation, but the broader market is currently in a horizontal range, using this candle and the previous one as reference. Within this horizontal range, we're currently testing the lower boundary, and a mini downward trend that started here is continuing. The daily chart interprets this as a continuing downtrend.
The previous day's candle closed as a long-shadowed doji. Since the candle before that was a bullish doji, yesterday was expected to trade within a horizontal range. The price range was anticipated to be between forty-seven hundred forty dollars at the top and forty-six hundred fifty-seven dollars at the bottom.
Yesterday's market indeed closed within this range, inside the doji. Looking at the real body, it closed with a sufficiently large bearish candle body, indicating that the small downward trend is continuing and the bias is stronger to the downside. That concludes the daily chart analysis.
Let's move on to the one-hour chart. Regarding the one-hour chart, we were filming the previous YouTube video just before this sell setup was formed. I explained the timing and profit-taking strategies for trading within a volatility-contracting horizontal range.
The price is now at the exact level I discussed, forming a sell setup, and has since dropped significantly. You can see it has fallen considerably. It has fallen approximately sixty-two dollars.
In pips, that's a drop of sixty-two hundred eighty-two dollars. This movement aligns perfectly with the scenario I presented yesterday. The scenario I presented yesterday involved strategies for trading and taking profits within a horizontal range with contracting volatility, and also mentioned that buying pressure could be expected around the recent support level.
Indeed, we saw buying pressure emerge as the New York market closed. Today, in the Tokyo market, after forming a clear reversal candle at the high reached earlier, the price has been falling with considerable downward momentum. When updating the low, a bearish candle is formed, and adjustments are being made in a horizontal range, indicating a time correction.
This correction suggests that bulls lack the buying power to test higher levels. Similarly, after forming another horizontal range, we've now broken out downwards. In Japan time, in about thirty seconds, the one-hour candle will close.
It will likely break out downwards from this bearish doji, and we can expect the price to drop by the width of this horizontal range. Today, the outlook remains bearish. That's all for today's gold analysis.