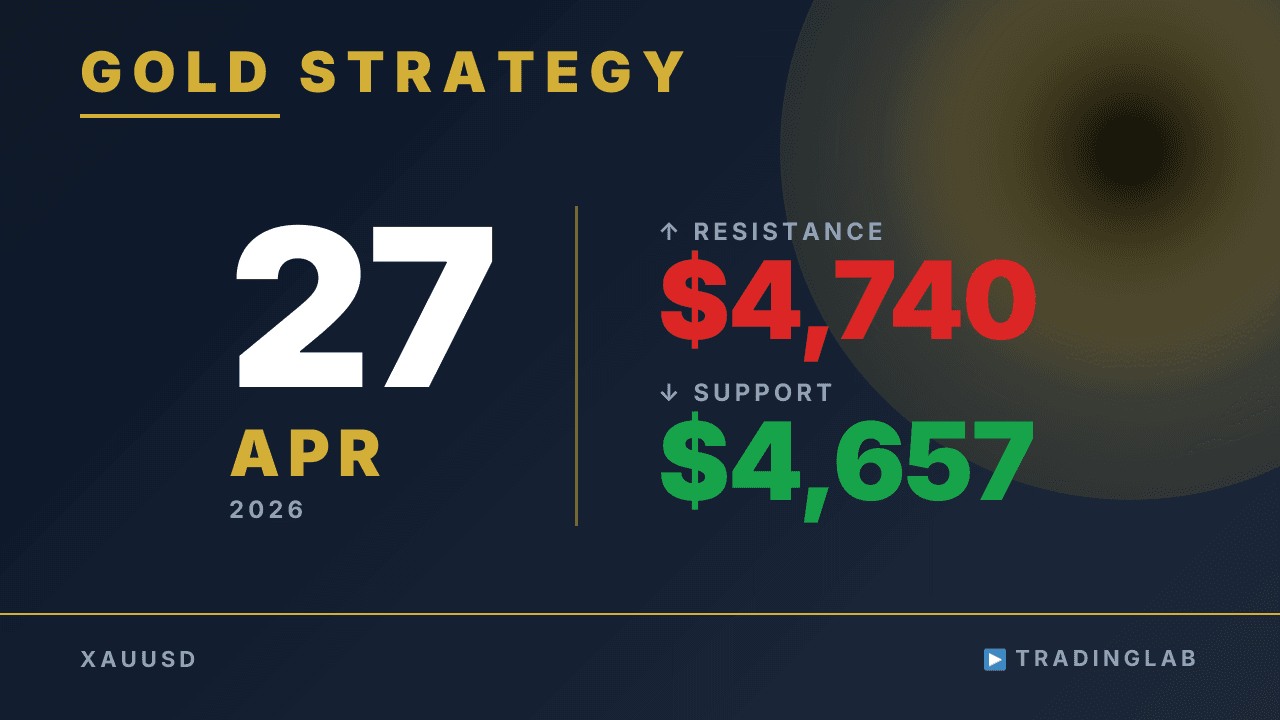
Gold is locked in a sideways range between $4,657 and $4,740 after a failed upside breakout confirmed a fakeout. Daniel breaks down why the daily doji signals continued downward pressure and why the current rate near the upper boundary makes shorting more attractive. Watch for how price reacts at these range boundaries heading into the week.
Gold Stuck in Range — $4,657–$4,740 Key Levels | Apr 27
 Watch on YouTube ↗
Key levels in this analysis
| Resistance | 4,740 |
|---|---|
| Support | 4,657 |
Summary
Video transcript
My name is Daniel, a professional prop trader with eight years in the market. I operate the FX salon, Trading Lab, with the goal of enabling even beginners to profit from trading. For more details, please refer to the description of this video.
Today, I'll be discussing the technical analysis of gold, partly including content shared within the salon. Let's start by examining the daily chart. Reviewing the daily chart situation, we are currently in a distinct sideways range.
This candle and this candle serve as reference points for this sideways range. We attempted a breakout to the upside once, but it turned out to be a fakeout, and we've returned to the range. Since then, I've been communicating that a minimal downtrend has been continuing at the daily level, and that view remains unchanged.
The most recent daily candle from last weekend closed as a doji. With the doji forming in this manner, it can be said that the weekend's movement was entirely a range-bound market day. Looking more closely at the shape of this daily candle, we can see that both the high and low have been lowered, and it closed at a lower position than the previous day's candle.
Therefore, although it is a range-bound market, the overall trend can be said to be a continuing downtrend. Accordingly, for today, we need to consider that the high and low of last weekend's daily candle... ...are likely to function as the upper and lower boundaries of the range.
Therefore, this price range is important, and I need to inform you about it. The upper limit is 4,740 dollars and the lower limit is 4,657 dollars. These define the range's boundaries, so the price will generally move within this band.
Considering that the range will likely move within this price zone, we need to examine the intraday price action as a key point. Now, let's look at the intraday price action. As for last weekend, for salon members...
At this point... At what point, you ask? Around the time this doji was confirmed, we provided the following update.
Detailed explanations are exclusive content for Trading Lab salon members, so I'll just give a brief overview. First, we stated that unless a long entry point is formed at a daily support level, it would be difficult to initiate a long position at the intraday level. Second, we advised that currently, it's more rational to focus on short strategies for scalping and day trading.
Third, since the previous day's potential trend reversal was negated, it would be difficult to shift to an uptrend without an even better buying setup. We highlighted two setups in the update for salon members last weekend. The first one here, regarding this buying setup.
It significantly overlapped with the recent candles, and the downward momentum up to this point was very strong. Therefore, this setup did not offer enough advantage to initiate a long position. For the second buying setup, also here.
Similar to the first, the downward momentum just before this was very strong. And in most candles here, while it appeared to be a failed breakout to the downside, it initially moved upwards. However, if you look closely, it closed as anイン線 (in-sen - bearish candle).
Therefore, it was not a complete confirmation candle. Consequently, the previous... high point, here, failed to break out upwards, and after forming a range again, it reverted to a downtrend.
This is how we reviewed the situation. Last weekend, we mentioned that unless there was a good setup, there would be no reversal to an uptrend. After the broadcast, it formed a descending wedge and broke out upwards through this resistance level.
Looking at the subsequent development, it ultimately failed to break out upwards through this major high point. Therefore, it failed to reverse to the opposite trend, the uptrend. Then, at the point functioning as the upper limit of this range, and the recent high, it created a sideways range near this high, then reversed downwards.
Subsequently, continuing the downward momentum, it tested the downside from the market open this week. It stopped again near the recent high and is currently falling. As I mentioned, my perspective for today is to anticipate the continuation of the range.
If forced to choose between an upward or downward direction, I would lean towards a downward view. This is because the current rate is close to the upper boundary of this sideways range. I actually initiated a short position just before the London market opened. Therefore, my thinking for today is with a downward bias. This concludes today's YouTube broadcast.