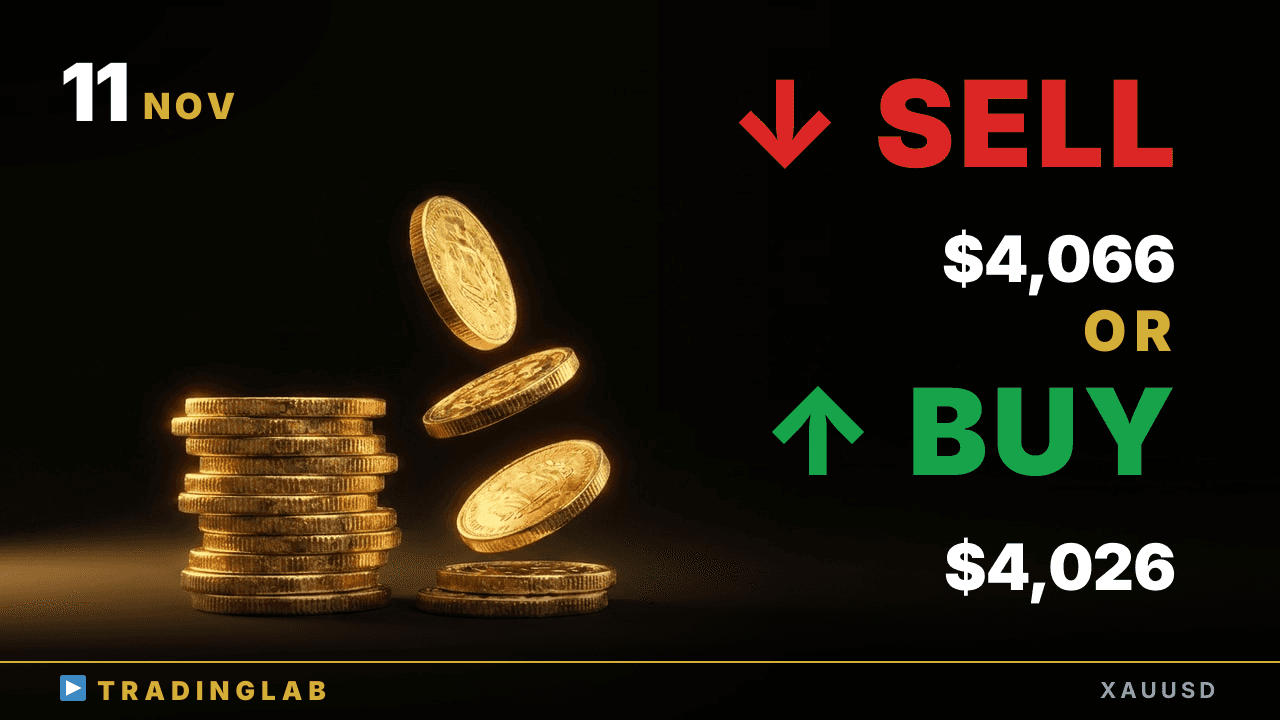
Gold bounced off the lower edge of the daily range after a $113 drop — now it's a coin flip between 4,066 and 4,026. I break down the daily range candles, the 1H sell signal that played out, and why a failed upside breakout is still on the table. Watch 4,013 below and 4,146 above for the next real move.
Gold 4,066 or 4,026 first? Today's two scenarios | XAUUSD Nov 11
 Watch on YouTube ↗
Key levels in this analysis
| Resistance | 4,146 · 4,066 |
|---|---|
| Support | 4,026 · 4,013 |
Summary
Video transcript
Hi, I'm Daniel, an active prop trader. Today gold has a short-term bullish bias, but on the bigger picture I see it returning to a trading range. Since last time, just as we expected, gold reversed from the upper boundary of the daily range, and we've since seen a drop of 113 dollars, a full 1130 pips.
Right now, gold has bounced off the lower boundary of the daily range and is forming a rising trading range, but this is a phase where we should watch for a failed upside breakout and then another drop lower. The key question is whether gold keeps climbing to test the upper boundary of the daily range, or reverses and breaks out below the range, and that's what I focused on in today's analysis. So let's jump right in and take a closer look at the daily chart first.
Yesterday's gold candle, number 49, officially closed as a large bearish candle. Now, if we focus closely on the candle body, you can see it failed to break out below candle 47, so we're still in the same sideways trading range, with candles 46 and 47 serving as the reference candles for that range. Ranges like this usually tend to continue for a while.
So the most likely scenario, in my view, is that today closes as a bullish candle, and then we see a reversal back up toward the upper end of the trading range. On the other hand, if today's daily candle closes as a small one near the lower end of the range, whether bearish or bullish, then a breakout from tomorrow onward is a very real possibility. If things play out that way, I'd especially like to watch how price moves right at tomorrow's Tokyo session open.
That said, if we also want to keep a downside breakout scenario in mind for today, just in case, then I think we should be prepared for a move that tests candle 43, the candle that marks the starting point of this recent bullish market move here on the chart. That wraps up the daily chart, so now let's move on to the 1H chart. On the 1H chart, this red line section marks the point yesterday when I was doing a live stream exclusively for our Trading Lab community members.
Here on YouTube, I'll walk you through the key points of the technical analysis and the trading scenarios I explained at that moment during the live stream, so let's keep going. First off, at the time of this stream, price was trading near the upper boundary of the daily range, but you could say the upward momentum was looking fairly weak. The higher highs were also getting shallower, so I mentioned that even if price kept breaking above the daily range, I'd want to watch for a reversal after a so-called three-push-up pattern.
After the upside breakout, by the textbook I'd naturally consider a long entry on the pullback following the daily range breakout, but I was thinking that trade would likely hit a stop loss. Of course, I said it could easily hit a stop loss, but that doesn't mean I'd skip the trade. That's because a breakout of a key daily-chart level can offer a really large price move, so I explained that not entering the trade just isn't an option.
And I explained that once you've entered, you really need to carefully assess the momentum in the price action. But we're near the top of the range, so downside moves become the main focus. As for the downside move, I'm looking back at the candlesticks from the previous day's London session, so roughly around this area right here on the chart.
So first off, a drop down to roughly this area is one of the clearest, easiest scenarios we can consider here on the chart. After that most recent doji candle breaks out to the downside, we can consider a short here, and if momentum is strong, look at that day's Tokyo session, right around this area. and I'd also want to target moves like a breakout from there, then a pullback.
And I've also broken down several notable price action signals in the moves since the last analysis. The London session candle I mentioned earlier formed a bullish reversal candle. It formed a bullish reversal candle with a key round-number level right below it.
In fact, my scenario for that day was that if a bullish reversal candle formed, I'd look to set up a long entry, as I'd mentioned. And sure enough, after a deep correction, price formed a strong bullish reversal candle just before that key level, which is price action showing the bulls were really in control. After that, the upside follow-through continued, and into the New York session, London turned into a strong bullish trend day.
Then the New York session opened, and the first 1H candle at the open was a doji, followed by an outside bar that also formed a doji, so a trading range looked highly likely, but after a brief downside breakout, that breakout failed, and true to theory, price moved up to test the top of the range. From there, price pushed on and broke out above the top of the range, but the upside follow-through lasted for only a single candle, so it formed a range again and then broke out to the downside.
Then in the Tokyo session, after that big drop, price formed a doji candle and broke out to the upside from that indecision, and we were heading into the London session waiting to see whether any real follow-through would be confirmed. Either way, look at that first bullish reversal candle and the second push higher from there. Even though price left such a strong candle on the chart, the follow-through was weak, and the higher highs only stepped up by a narrow margin.
So at that point, we could clearly read this as a sign of weakening upside momentum. So how did gold actually move after that? Just as we expected, price never managed to break above the upper limit of the trading range, formed a clear sell signal, and then we saw it start to move lower from there.
Measured from the time of our broadcast, gold dropped roughly 113 dollars, which is around 1130 pips, moving lower exactly in line with the bearish view we shared. So today, in our members-only broadcast for the Trading Lab community, I've broken down the technical analysis and scenarios from here into three key points. First, a bounce off the daily range low, so short-term we're bullish.
Second, as long as the rise continues, we prioritize buys. Third, stay alert for a reversal or a renewed drop when the sessions switch over. The first candle of the London open has just started, and depending on how it forms, a reversal is entirely possible.
That's because the chart has formed a rising trading range, so I think a decent drop is quite possible here too. That's all for today's gold market analysis. Thanks so much for watching.