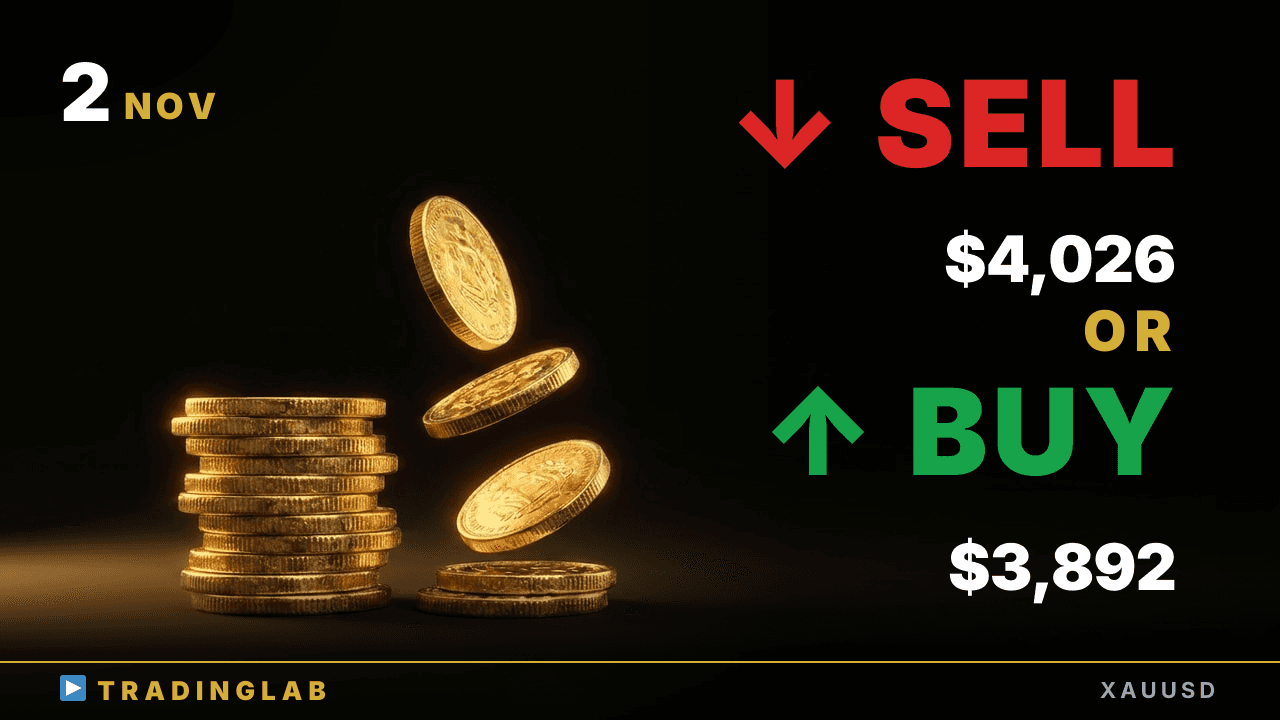
Gold bounced $34 then rolled over for a $117 drop, and price is now stuck in a Tokyo-session range. Daily is still a clear downtrend, so rally selling stays the base case — but a break below the range low is what confirms it. Key zones: 3,892 and 3,870 support, 3,919 and 4,026 resistance. Where I'd wait for shorts, and what would force a rethink into a bigger bounce.
Rally selling setup: the one level that confirms the next leg down | XAUUSD Nov 2
 Watch on YouTube ↗
Key levels in this analysis
| Resistance | 4,026 · 3,919 |
|---|---|
| Support | 3,892 · 3,870 |
Summary
Video transcript
Hi, I'm Daniel, an active prop trader. For gold today, my bias leans more to the downside. Since the last video, price has moved exactly according to our scenario: from the London session open, gold bounced 34 dollars, or 342 pips, then rolled back over and returned to the downtrend.
From the low of our setup, we've now seen a drop of 117 dollars, roughly 1176 pips when converted, and that decline is clearly confirmed on the chart. Right now, price has been stuck in a trading range since the Tokyo session, and it's lost its sense of direction. But the daily chart is still clearly in a downtrend, so my basic plan is to prioritize rally selling here.
The key question is this: will price build a rising trading range from here and then drop sharply lower, or will it break out below the Tokyo session low and resume the downtrend? That's what I'm focusing on in today's analysis. Alright, let's start by taking a detailed look at the daily chart for gold.
Looking at the daily chart, last week's final candle closed as a big, strong bearish candle. Since it's a big bearish candle, we can first rate the downside momentum as really strong. That said, my base case from here is basically that we'll likely see some kind of pullback-style move develop next on the chart.
On the other hand, if the downswing just keeps going without any pullback, it would basically be carrying over the momentum straight from the previous candle, bar 49. So in that case, my judgment is that we should watch for the bearish breakout of bar 49 and plan our short entry based on how that breakout actually plays out. Also, because the big bearish candle on bar 49 was extremely strong, if price bounces and moves into a corrective phase, any upswing that follows will likely struggle to sustain itself.
So entering longs here is really difficult, and it's important to wait until price is pulled down to the short-term range low. If this candle turns into a pullback, then given how strong the momentum was here, it's most likely to be a time-based correction, with price staying inside the range of the prior candle. But if it becomes a price-based correction instead, then rather than seeing it as a simple correction, candle 49 here is more easily read as a kind of selling climax candle.
And after that, if we then see a move where the upward momentum keeps building, my read is that the situation would shift into one where we'd have to seriously consider a full trend reversal to the upside as well, rather than just a temporary bounce. So, on the daily chart, for now the key point is to stay alert for a possible rebound. Let's drop down and look at the 1H chart timeframe.
Now, on the 1H chart, at the end of last week we held a live stream exclusively for our Trading Lab community members, right around this area of the chart. Here on YouTube, I'll walk you through the key points of the technical analysis and the trading scenarios I explained at that time, focusing on what matters most. First, on the daily chart, I still held a bearish outlook.
Price had already fallen all the way down to the downside measured move target, which was based on the daily doji candle, so I explained that in the London session, this was a point where we'd want to consider a temporary rebound to the upside. Also, looking at the most recent bear channel, price had briefly overshot below the channel right at this low. So I was already anticipating that the second candle after that would close bullish, and that the most likely move would be an upside rally that first tests the previous day's Tokyo session high on the daily chart.
That day's Tokyo session high sits right around this level, and that's the scenario I'm currently considering. Also, once price reaches a key level like this, I'd want to carefully reassess the momentum there. If bearish price action forms, it's easy to picture the market coming back down to test at least this low here again, and that's the scenario I was weighing at this point.
On the other hand, if price pushed strongly above those key levels, meaning the previous day's daily low and the Tokyo session high, and the follow-through after that breakout also came in strong, then I explained we'd want to stay alert for a shift into a short-term uptrend rather than the bearish scenario, at least for the time being. One more thing, I also went back and reviewed some of the key price action. Starting from which point?
From the bullish doji candle that serves as the reference candle for this sideways range. Everything after that hadn't been covered in our community yet, so I've walked through several key levels. First, after the bullish doji that formed in the second hour of the London open, a sideways range continues, with that candle as our reference candle.
At candle 6 it first tries a downside breakout, but the very next candle fails. So we get a breakout, a failed pullback, a failed breakout, and a candle we can clearly read as a bullish reversal candle. After that bounce, you can see price actually turned lower at this bearish reversal candle and formed another clear downswing.
So in the end, looking back, this candle can be read as a return to the sideways trading range, after a deep breakout beyond it and then a pullback back into that range. In reality, it was hard to judge that in real time, so the most realistic entry point would be the first hour of the next day's Tokyo session open, which clearly formed a bearish doji with a long upper wick testing the range, then broke down out of the range, so you could enter on this breakout candle itself, or place a sell stop just below the doji's low, as the setup allowed either approach.
Within this flow, after the downswing continued, here's the measured move we could project on the daily chart. At stream time, the daily chart had broken below a doji and printed a big bearish candle, and my call was to treat that doji candle as the basis for the measured move. Price had overshot this level, and we could also confirm an overshoot of the most recent channel line, so my scenario was that gold would likely see at least a temporary bounce here.
So then, how did gold ultimately end up moving here? Exactly as my scenario laid out, we saw a clear bounce off this level confirmed heading into the second hour after the London market session opened. First we got a solid bounce of $34, or 342 pips, and then price rolled right back into the downtrend, dropping $117 when counting from the setup's low.
After that, price really kept sliding lower, and we've confirmed a drop of about 1176 pips in total on the chart. So today, in the exclusive stream for Trading Lab members, I'm breaking down these 3 key points. The Tokyo session is still in a range, with no clear short-term direction.
On the daily chart the downtrend is still intact, so basically we stay focused on the downside. After confirming the move once price clearly breaks out of the range, we're watching for the decline to resume, so we're now fully bearish here, So today I walked you through where to look for short entries, and whether we should treat this as the start of a renewed downtrend. And that's all for today's gold market analysis, everyone.