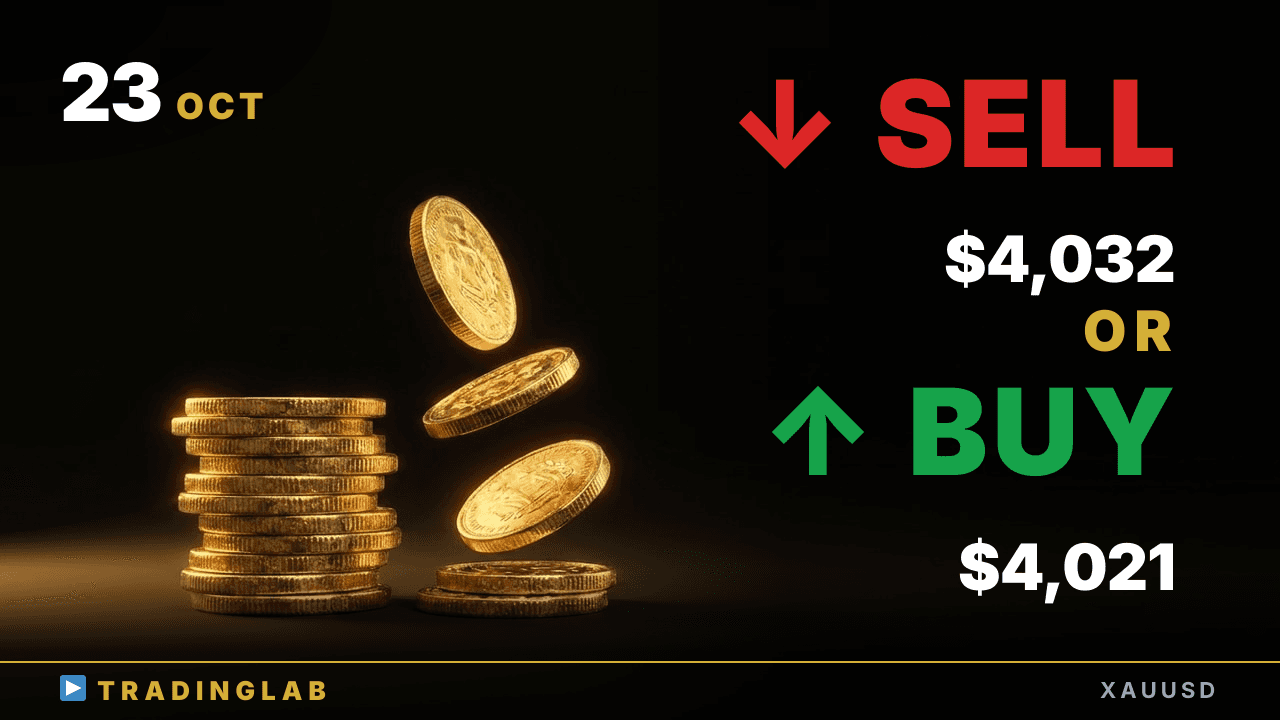
Gold broke the daily range to the downside and momentum is still firmly bearish — I'm prioritizing rally selling until a clear reversal pattern shows up. I walk through the pullback zone I want to short from, the 1H confirmation I need, and the measured-move target near $3,911. Watch 4,021 and 4,032: a clean break back above yesterday's low and the Tokyo high is what flips the bias to a correction.
The one level that flips gold's bearish bias — sell the rally or wait? | XAUUSD Oct 23
 Watch on YouTube ↗
Key levels in this analysis
| Resistance | 4,140 · 4,032 |
|---|---|
| Support | 4,021 · 3,986 |
Summary
Video transcript
Hi, I'm Daniel, an active prop trader. Today my bias on gold is bearish. Since the last video, the downtrend played out exactly as expected, and we saw price drop around 1144 pips after my analysis went live.
Price is still in a strong downtrend, so until a clear reversal pattern forms, I'll keep prioritizing rally selling. But if price breaks above yesterday's daily low and the Tokyo session high, this is a phase where we should watch for a shift into a corrective move, a pullback in price rather than time. In today's breakdown, I focused on whether this downtrend keeps going as is, or whether we get a correction first and then signs of a trend reversal start to show.
So let's jump right in and start with the daily chart. Yesterday's daily candle showed a really strong, clear downward trend, and it ended up closing firmly as a big, long bearish candle. The daily range had held like this for a while, but now this downside breakout has played out.
In the case where this breakout ends up failing, today's daily candle should close bullish. And if it confirms as a strong bullish candle that cancels out close to 50% of the breakout move, then I think we should consider price returning back inside the daily range again, but Right now, though, this trend candle is really quite strong, the bearish momentum is strong too, and there's almost no wick at all, so my basic plan is to wait for a pullback first and then look for a short entry from there.
If this does turn into a deeper pullback, I think the wick of the candle that was acting as the bottom of the range we broke out of is a level that's likely to be watched closely by traders as a key level. Around levels like this, if we confirm a reversal pattern on the 1H chart, we can expect follow-through to the downside afterward, so going short into that falling move is a setup we can consider from a daily-timeframe perspective. And if that downside follow-through does play out, what happens next?
This sideways range is likely to work as a measured move, so if we take the full height of that sideways range and project it down from the breakout point, I think a realistic short-term target, and a practical level to aim for, is somewhere around 3,911 dollars, roughly in this area. Next, let's move to the 1H chart. The red line marks where price was yesterday, when I ran the exclusive stream for Trading Lab members.
So what technical analysis and scenarios did I walk Trading Lab members through at that point? Here on YouTube, I'll narrow it down and cover just the key points. First, looking back at the price action around my last broadcast, there was a clear downtrend that kept going, but toward the Tokyo session close, a bullish reversal candle had formed.
After that, the market opened into the London session with a failed upside follow-through, so a trading range had formed using these two candles as the reference bars. That said, the most recent candles showed strong bearish momentum, and naturally any bulls who had entered long here would be stuck with a growing unrealized loss every time price dropped further, which is why I clearly told you my bias was to the downside. At the same time, though, just as I mentioned at the very beginning, it's also a clear fact that price was still sitting inside the trading range built on these two candles as the reference bars, and that range was still in play.
So that's what defined yesterday's market: the point where our bias would flip was very easy to spot. Look at this high from the London session open, right here. At that point it was still the current high on the chart, so if price broke cleanly above that level, that was one clear benchmark for considering a switch to a bullish bias.
And if that happened, the stop losses of the bears who'd been selling here all along would get caught up, pushing price higher, so momentum could easily build. I'd worked that out too. That said, a trading range usually tends to break in the direction of the original trend, so I'd been telling everyone my bias was to the downside.
And inside our Trading Lab community, I also broke down the price action for the parts I hadn't covered here yet. Now I'm reviewing how gold has moved since my previous analysis stream. First, look at the 1H candle from the second hour after the Tokyo session open two days ago.
After that bullish doji formed, the Tokyo session clearly settled into a sideways trading range, Then, heading into the New York session open, the London session resolved that doji pattern, and an upside breakout from the range was attempted, starting from the outside bar that formed right after it. However, right at the New York session open, a bearish reversal candle formed and this breakout ended in failure, and after that, a series of consecutive doji candles built a range, In practice, the price built a wider trading range, one that effectively expanded outward from the sideways range set by the very first two candles.
Having tested the upper limit, theory says the lower limit comes next, and the 8th 1H candle of the New York session tested the low before reversing, and after that it tested the upper limit again, formed a bearish reversal candle, and is now testing the lower limit of the range once more as the Tokyo session opens. This back-and-forth, up and down, testing the upper limit and then the lower limit, is exactly how a range really behaves, so I don't think this was a particularly difficult market to trade.
Also, the small candles that formed near the upper and lower limits of the range are very clear candles to read, With this doji candle, if price breaks out below its low, naturally we'd look to enter a short position right away, and if it breaks out above, we can set up a long trade targeting the upper edge of the range, but it's not good to hold a view biased toward only one side, Even a single doji candle acts like a sideways range, so price tends to run in whichever direction it breaks out, so I'd say it's a candle where you can set up trade entries in both directions.
However, after candle 3 broke out to the upside during the Tokyo session, price went on to form another doji candle right after, signaling indecision in the market, so the upside breakout failed, so we took one stop loss there But as you can see, a clear trend candle broke out below the low of candle 3, Since that level is once again acting as a key level here, the entry itself really wasn't that difficult, I think.
After that, the downside follow-through continued into the Tokyo close, through candle 6, Candle 6 closed as a bearish pin bar, and then as for the London session open, Whether this bullish reversal candle would work was a key turning point, It closed as a bullish doji with a long upper wick, so a sideways range using those two candles as the reference was likely to form. Since ranges usually break out in the trend direction, and the overall higher-timeframe trend is a downtrend, so basically, I'd been telling you my view on gold was mainly to the downside.
And in the end, how did the gold market actually move? Let's check the chart. So, continuing the downtrend, the range, as expected, broke out in the direction of the trend.
We got a clear breakout pullback, plus an ideal chance to enter the trade. I broke this setup down in detail today for Trading Lab community members. Exactly as the scenario laid out, gold dropped $114, which in pips comes to 1144 pips, meaning price has kept falling ever since the stream went live.
Now price is consolidating around the previous daily candle's low, but Today, the scenario I explained in our Trading Lab was built around these three key points. First point: the strong downtrend continues, so we stay bearish for now. Second: until clear signs of a reversal line up, we want to avoid hasty counter-trend trades.
Third: if price breaks above the recent key level, I noted to watch for a shift into a price-based correction. The key point for today is this: if price breaks through the most recent key level on the chart, That's the point where I've said it's not a bullish view, but a shift into a price correction. That's right after price broke below a key daily level, plus the breakout candle was a very strong bearish trend candle, and that's our key basis. We went over this in more detail today inside our Trading Lab community. That's all for today's gold analysis.