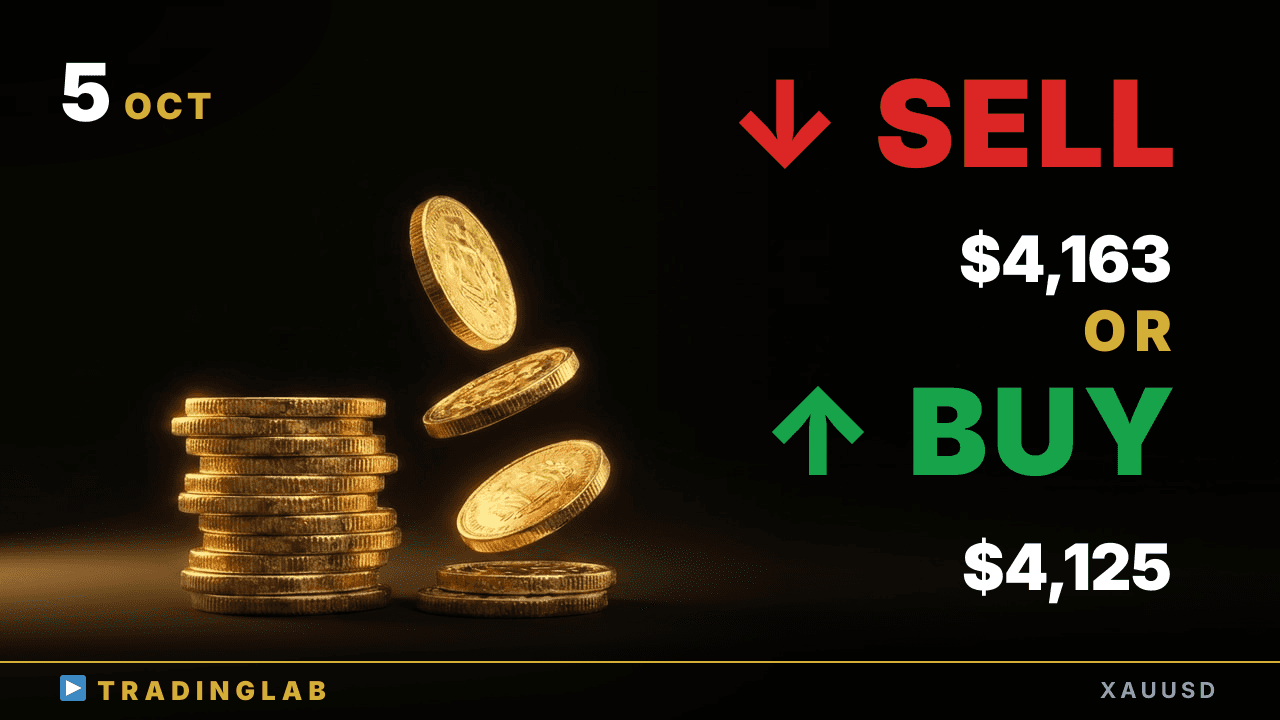
Gold printed a second bearish reversal candle off the pullback, with the Tokyo low and prior day's low overlapping as the first downside target near 4,125. The daily closed a bearish doji with a long upper wick — range reset in play. I break down the breakout-then-pullback plan: 4,163 reclaim flips the bias, 4,227 is the upper cap.
Gold at 4,125 support — breakdown extends or reclaim 4,163? | XAUUSD Oct 5
 Watch on YouTube ↗
Key levels in this analysis
| Resistance | 4,227 · 4,163 |
|---|---|
| Support | 4,125 |
Summary
Video transcript
Hey, this is Daniel, a working prop trader. Gold looks bearish today. Since last time, price broke out above the key high we were watching, but the pullback I was hoping to buy never showed up, and then it reversed and ran back toward that key price zone.
Price dropped around 100 pips, confirming exactly the scenario I laid out. Right now, off what looks like a pullback, we've got a second bearish reversal candle confirmed. First off, the Tokyo session low lines up with the prior day's low, so that overlap zone is where I'm expecting this drop to reach.
The big question is whether this downtrend keeps running, or whether price breaks above that recent key high and forces us to flip to a bullish bias — that's exactly what I've been watching and breaking down for you here. Alright, let's dive straight in and start with the daily chart. On gold, last Friday's daily candle closed as a bearish doji, so we've got a confirmed bearish doji on the daily chart there.
For the daily scenario I'd laid out, the candle right before that one printed as a bullish doji on the daily chart. On top of that, since this candle overlaps with the doji one bar before it, I pointed out that price was really just moving back and forth within almost exactly the same price zone. I explained we should treat this bullish doji as our base candle and recognize that a sideways range is likely to keep playing out at the daily chart level here.
And on the breakout play itself, I made the point that the smart move is to wait patiently for the breakout and then the pullback before you actually enter the trade. So in the end, the daily candle closed as a bearish doji, settling right around the open with a long upper wick. As that long upper wick shows, if you got lured in by the strong short-term momentum and jumped in, then as a trader working off the daily chart, you naturally would have been stopped out here.
With moves like this, waiting on the same timeframe until you get a confirmed pullback before entering is almost always the right call as a trader. We can actually see the magnet effect too, as price gets pulled back inside the body of that bullish doji candle. One thing to watch, though, is that we've got an inverted shape here with volatility expanding right off the prior candle.
For the market to pick a direction from here, we'll need to see volatility contract, and since we've also got an outside bar forming right now, I think there's a strong chance the short-term range has basically reset itself here. So for today's strategy, we're working on the assumption that a range is very likely to form within yesterday's candle, inside that daily candle's price area. For the move that comes next, the break out of this range, if you want to trade it on the daily level, it's more efficient to wait for a daily-level breakout and then a pullback before you enter.
That wraps up the daily chart, so let's drop down the timeframe now and look at the 1H. On the 1H, this red line marks where the chart was last weekend, at the moment I did the early release for our community members. On YouTube, I'll walk you through the technical analysis and the scenarios I'd laid out for the community at that point in time, breaking down exactly what I was watching.
The first candle I flagged to watch was this bearish doji, and I explained that we're now sitting inside a small sideways range built off of that candle as our reference. And in terms of flow, the Tokyo session gave us a trading range, and then over in London we saw volatility contract before settling into its own trading range. Right now there's no clear directional bias, as I was explaining earlier.
Looking at this sequence, after a wide trading range formed in the Tokyo session, we're now seeing a smaller, tighter trading range building in the London session. For the New York session, textbook theory says this setup tends to produce a trend day. So as I was saying, at the New York open what we really want to focus on is the direction of the breakout and how strong the momentum behind it is.
With that in mind, the core scenario is this: if we get an upside breakout above this doji candle, I'd wait for a pullback first and then look to consider a long entry from there. On the flip side, if price breaks below this low here, I'd expect it to keep falling down to around that recent bullish reversal candle we marked earlier. My outlook had price dropping all the way down to the low that was printed right at the Tokyo session open that day.
And the price action that led me to that call — I picked out several key candlesticks worth watching and broke them down in detail inside the community. So this covers the price action since the broadcast before last — starting right here. After printing a bearish doji, the downswing off that recent bearish reversal candle wrapped up, and once a weak bullish reversal candle formed, price pushed past this high and built an upswing running right into this bearish doji.
This turned into a bearish reversal candle, and from the New York session open price started selling off, but it ultimately settled into a trading range — a perfectly natural setup leading into that kind of range. We never saw volatility actually contract here — there was still a fair amount of movement — yet neither the highs nor the lows got taken out, so from the New York open this was clearly the kind of price action that naturally builds into a trading range structure.
And if you zoom in on the individual candles, you'll notice lots of dojis with heavy overlap between them — so through the New York session there was almost no sense of direction at all. Then we move into the Tokyo session, where volatility had been shrinking, and after it broke out with a strong move, by the second hour from the open it printed the low of the day, reversed, and climbed back to just slightly above the high — so the final read on the structure here is that it settled into a trading range.
After that, volatility contracted again, and the reference candle here was this bearish doji, with the London session open being watched closely — and the situation was that we were now heading into the New York session open. So in short, the plan was to prioritize whichever way this doji broke out, and on the upside specifically, I'd told you to wait for a pullback before jumping in and taking the trade. On the downside, my scenario had price dropping all the way to the Tokyo session low.
So what actually happened? This doji's sideways range broke to the upside, right around the time of that economic data release, I believe, but there was no pullback move at all after that break. Once a bearish reversal candle formed, price dropped toward the Tokyo session low, falling roughly 100 dollars, about 1001 pips on the pip counter, exactly as my scenario had laid out.
Now, for today's breakdown prepared for our community members, I walk through both the bullish and the bearish scenarios, and I explain each of them using these three key points. The first point is that we've confirmed another reversal off the recent bounce, so right now the bias is bearish. Second, if the selloff keeps extending, watch closely how price reacts at the key downside levels below, and I've walked you through concrete examples of that too.
Third, if price clearly breaks above the recent swing high, consider flipping to a bullish bias, and I covered exactly that scenario in detail as well. So, while I'm walking you through all of that, let me pick the thread back up: after a sharp drop driven by really strong momentum, what we're seeing right now looks like a corrective pullback. We're forming a bearish reversal candle for the second time, so I'm basically leaning to the downside here. That wraps up today's gold update.