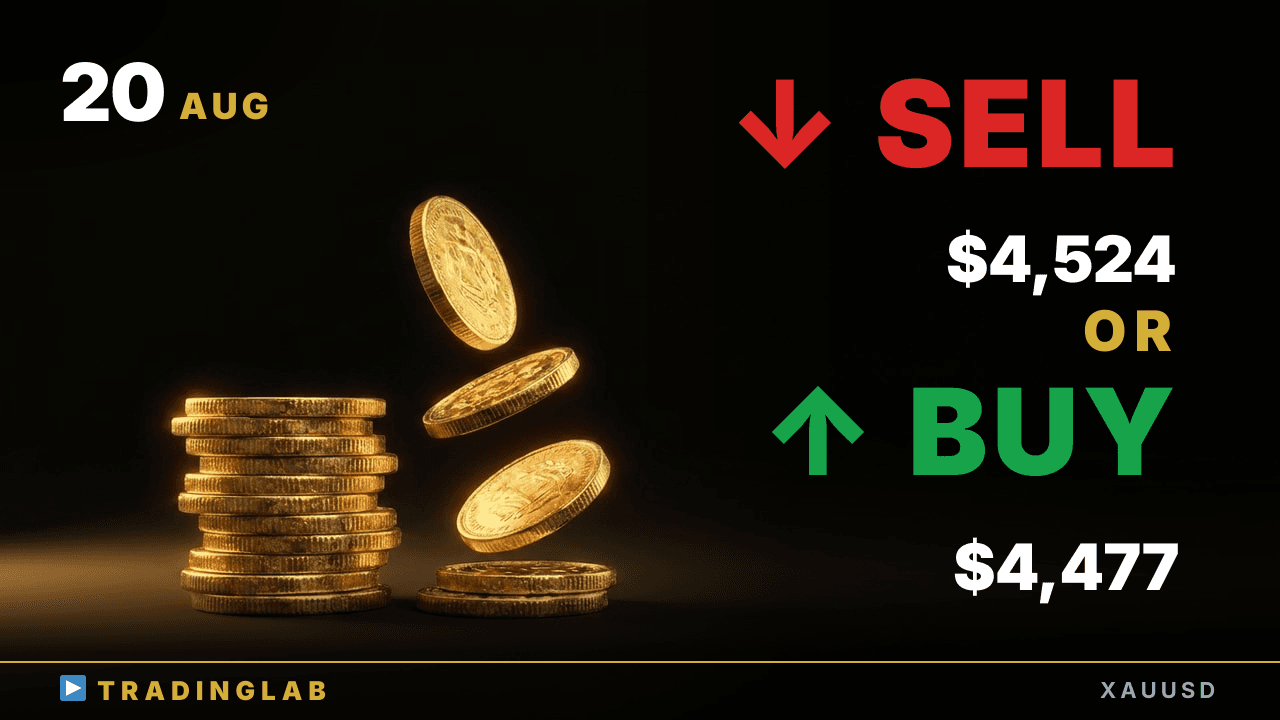
Gold broke out of the daily range and ran ~$188, and now it's pulling back into the breakout zone. Short-term bias is down, but a bullish signal at 4,477 could flip it back up — 4,324 is the deeper support. Watch 4,521–4,524 overhead as the level bulls need to reclaim. Daily and 1H structure, plus the long setups I'm tracking into tomorrow.
Gold pullback: hold 4,477 support or slip to 4,324? | XAUUSD Aug 20
 Watch on YouTube ↗
Key levels in this analysis
| Resistance | 4,524 · 4,521 |
|---|---|
| Support | 4,477 · 4,324 |
Summary
Video transcript
Hey everyone, this is Daniel, your energetic prop trader. Short-term I'm bearish on gold today. Since last time, price broke above the Tokyo session high and flipped into an uptrend.
Just like the scenario I laid out, it then broke straight above the daily range and rallied roughly 1889 pips higher, exactly as planned. Right now we're in a pullback after that strong rally, so the focus is whether a buy setup forms at these key levels — the low made in the Tokyo session and the daily range we broke out of. The big question is whether price can shake off this correction and swing back into an uptrend, and that's exactly what today's breakdown covers.
So let's dive straight into the daily chart. On the daily chart, the previous day's candle closed as a big bullish candle. Yesterday, the daily scenario I laid out came down to these four key points.
Now, because the candle just before that closed as a big bearish candle, our original main scenario — a move down to test the low of that bullish doji candle — has effectively played out, and we can read the price action exactly as we expected it to unfold. Next, because this candle closed as a big bearish candle, if we now see downside follow-through develop from here, that momentum can easily carry price into a downside breakout of the sideways range we've been tracking, which is exactly the kind of continuation we want to watch for.
Third point: if today's daily candle instead closes bullish, then depending on how large that candle is, the odds increase that price breaks upward out of the sideways range built on these two candles as the reference. And the final point: either way, from the current price action, we can say an opportunity for a breakout of the daily sideways range is now drawing closer, and that's exactly what I was walking through here. In the end, yesterday's daily candle closed as a big bullish candle, so exactly as our scenario laid out, price sweeping the stop loss orders placed by the bears around these points is what fueled the upside breakout of this sideways range.
Since we've now broken out above the sideways range, the daily bias from here stays bullish, and we keep looking for upside continuation. If price makes a pullback back into this sideways range, a classic breakout-pullback move, then that kind of setup would actually give us a valid reason to look at going long even on the daily timeframe. So it's a scenario worth watching closely for a long entry.
Now let's drop down and take a look at the 1H chart as well. On the 1H chart, right around this red line, just as this big bullish candle closed, I ran a live session exclusively for our community members. Here on YouTube, I'll walk you through the key points of what I broke down for the community in that session, focusing on the essentials, and we'll keep the analysis moving from there.
Let's start by reviewing what the market just did. Going back to the New York session open two days ago, right here we saw a huge bearish doji form as an outside bar. Once that setup appeared, it flipped the picture completely, because from that point on, whichever direction this doji broke out of was very likely to set the market's next clear directional move going forward.
Then the next big bearish candle broke to the downside, and that downward swing ultimately ran all the way down here to this doji. Now we can confirm that this doji was the first reversal candle, and here's why: the failed downside breakout below this bearish doji turned it into a reversal low, giving us that first real turn back up. Now if you look at that downswing just before, it was a really strong, aggressive move, so to enter it correctly you'd need at least a higher low, or a second test of that same low level, before committing.
And that exact second entry setup lined up perfectly with yesterday's session, right when I streamed it live for Trading Lab members. With this reversal candle, right after that climactic big bearish candle just before, we got a large bullish candle that opened at the base of the lower wick and closed almost as a full body, and that's what forms a strong bullish reversal signal right here. So as the upswing continued to develop from here, the Tokyo session high from the prior day sat right at this level, and my point was that if price could push above it, that confirms a shift into an uptrend, so switch to a bullish bias and trade accordingly.
On the flip side, this Tokyo session high was the key trigger. And I explained that if the breakout failed, you'd treat that level as a rally high and stay bearish, positioning from the short side. So the whole focus was whether gold could clear the Tokyo session high or not.
Now, tracking the price action after the broadcast, gold broke out cleanly above that Tokyo session high, and the setup that followed lined up at a really nice spot, clearly visible even on the 1H chart. In terms of range, if you count from right after the broadcast, gold rallied a full 188 dollars, which works out to 1889 pips of upside in one strong, sustained push. Volatility had been pretty thin lately, so honestly this was a really welcome, satisfying move to see play out.
Today I've also shared my actual trade history with the community. Right around here, at this bearish reversal candle, I closed out my long position first, and then once we got the breakout right here, I re-entered and got back in. So for everyone in the community, take a moment to compare this against your own trades and put those lessons to work in your future trading.
In today's community-only session, just like always, I walked through both the bullish scenario and the bearish scenario, and then I broke everything down around three key points that really tie the whole picture together. Right now we're in a corrective phase after a strong rally, so the short-term bias is to the downside, but if a bullish signal prints at a major key level, we flip back to the upside, and I actually called out exactly which levels to watch.
Last point I covered: the bullish momentum hasn't recovered compared to yesterday, so I'm on guard that this corrective phase keeps running rather than reversing higher just yet. Most recently, we've got a small candle forming inside that bearish doji, drifting sideways and coiling right there. You could say we're sitting right around the Tokyo session low here, so the battle at this key level is going to be really important, and I think how it plays out will decide where price heads next. That wraps up today's gold update.