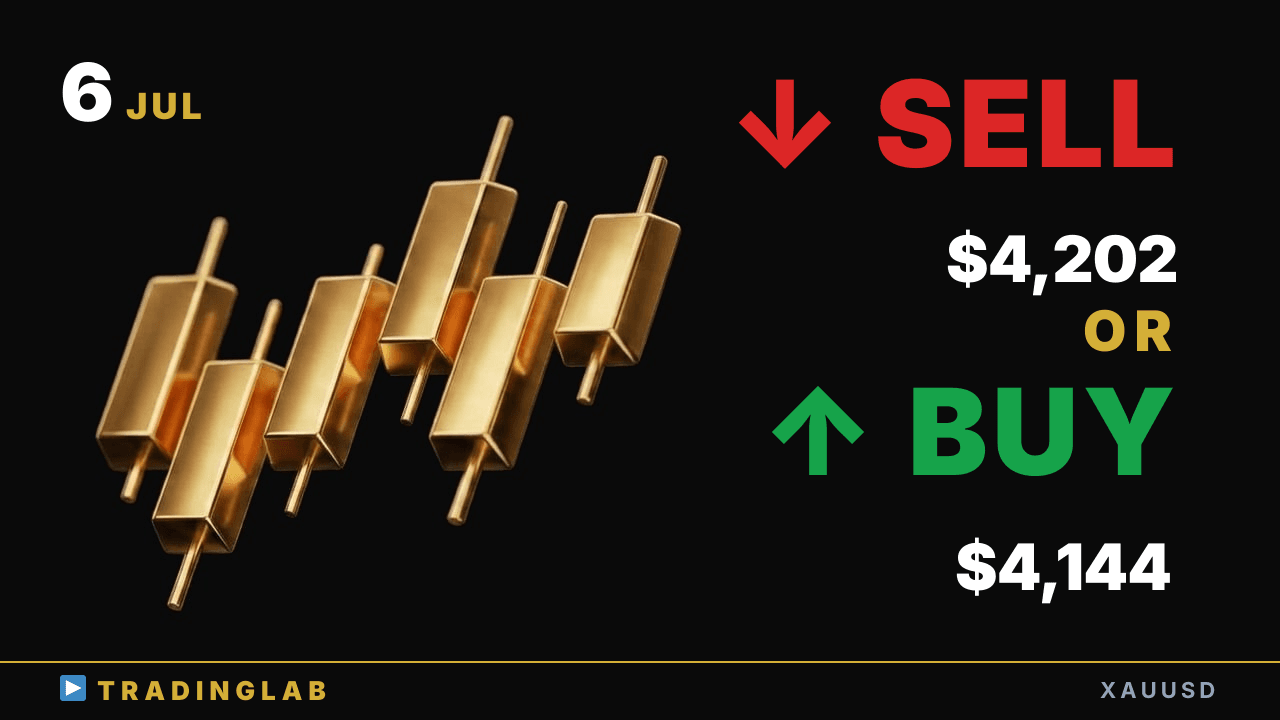
Gold hit its measured-move target near 4,202 and is now showing a bearish daily candle — is this the pullback before the next upswing? Daniel maps support at 4,144 / 4,121 and the resistance band at 4,202 / 4,195. Watch where the correction bottoms to time the next long toward the daily channel top.
Gold tags 4,202 target — pullback to 4,144 or next leg up? | XAUUSD Jul 6
 Watch on YouTube ↗
Key levels in this analysis
| Resistance | 4,202 · 4,195 |
|---|---|
| Support | 4,144 · 4,121 |
Summary
Video transcript
Hi, this is Daniel, an active prop trader. Gold is leaning bearish for now, and before I flip to an upside view expecting a return to the uptrend, I'll confirm the reversal conditions as always. Last weekend, as I explained for the community, once the trend reversal conditions were met, price dropped roughly 573 pips from today's Tokyo session open, exactly as I laid out.
This downtrend structure is still intact for now, but last weekend's uptrend was extremely strong, so to avoid missing the next reversal, it's important to have a clear standard for when to flip your bias. Now that we've covered the bias, let's move on as always and start our detailed breakdown from the daily chart. Looking at last weekend's daily candle here, it closed as a solid bullish candle.
Now, what I mentioned last weekend was this: if price could break out above the high of this big prior bullish candle with a solid bullish body, then the bullish bias would remain intact going forward. And since price did in fact break out above that prior high to the upside, the bullish bias stays firmly intact. On the bigger picture, it wouldn't be surprising to see price come up to test the upper edge of this blue channel, so the bullish bias still holds on the daily.
That said, the issue here is that this is the candle where price finally managed to break out above that inside-bar doji sitting right at this level. After breaking out of this candle, we still haven't seen any clear pullback develop yet, and that's the key thing here. If we treat this doji as the measured move, then this exact zone lines up perfectly as our measured move target.
Since price has now tagged our upside target at the highs, we need to keep in mind that in the short term this is a spot where we can easily see a pullback or some corrective consolidation. Today's daily candle isn't confirmed yet, but we're seeing a solid, decent-sized bearish candle forming here. Looking at this move, you can clearly confirm that the market tends to slip into a corrective phase here.
And once the correction wraps up, you can treat this low as the origin point that kicks off the next upward swing. If a correction forms from here, the move after it becomes the second upward swing, so that's the setup we're watching for next. If that plays out, there's still plenty of room to run up toward the upper edge of the daily blue channel.
So there's a real chance we see a fairly big move to the upside from here, worth keeping in mind. That wraps up the daily chart, so now let's move on and dig into the 1H chart. For the 1H chart, coming up I'll walk you through the analysis I shared with community members as of Friday's close in detail.
I'll just quickly run through the key points here on YouTube. First key point is that the strong bullish momentum keeps pushing on. So my bias here is to favor pullback buying as the primary play we're watching.
That's because last weekend's community stream was recorded right at this red line. Looking left from this red line marker, at that point, we had a strong uptrend still running with really powerful bullish momentum here At these key points here, we've now seen the market push higher with one, two, three upward swings in a row. With gold, we very often see it just keep extending higher from here.
Especially when a strong uptrend kicks in, we see this play out a lot. Taking all of that into account, I concluded it just makes more sense to keep leaning bullish, so that's the bias I was laying out for you here. Also, I really believe you should always have a scenario ready for both directions, so keep both sides in mind.
You should also keep a possible trend reversal in mind. For a trend reversal, we don't rely on chart patterns here. We make the call only once the reversal conditions are met, and I walk you through that too.
The first sign is obvious, of course, and it's simply a break of the trendline. That's the first condition, but I add several others on top of that too. This lets me spot trend reversals with a pretty high degree of accuracy.
Inside the community I break this down in the lessons and the daily updates too. And the way price moves through the process leading up to this point really matters. It's not just one pattern — how the current pattern was built along the way really matters too.
So let me pick out a few of the price action signals I was watching there. The first thing I was really watching here was this doji candle. Now this doji candle, beyond just being a doji itself, matters here.
It formed an outside bar that fully engulfs the previous candle. So what kind of price action does an outside bar actually show us? Basically it's a candle that tells you to follow the direction of the breakout.
Also a doji tends to resolve in the breakout direction, so watch that closely here. There's one candle here doing exactly that same role right now. Naturally, you'd enter a long just slightly above the high of this candle here.
Since the doji was very small, if it breaks the other way you'd just place a stop sell order right down here. That's the kind of setup I'd personally play here. Once it broke out to the upside, follow-through candles kept extending all the way up here.
The upward momentum right up to here stayed remarkably strong. And then we get the first reversal — the upswing that kicked off from this candle. The first reversal attempt does succeed, but the momentum is weak here.
On the 5-minute chart, this formed a clear bull flag. Once that bull flag breaks out to the upside, price starts building another fresh upward swing. Right here it prints a climax candle, and from there price pulls back down again.
Whether the trend keeps developing or not, either way I see the high of this candle as a level that should get tested again. Even before that starts, price is going to test all the way up to this level, so that's the scenario I already had in mind heading into this session. Last week's stream had already wrapped up by then, so let me walk you through exactly how gold ended up moving after that.
Late last week price shifted into a sideways range, and then it broke straight down through this rising trendline. At the Tokyo session open today, within roughly the first two hours, we saw a move that came back to test the high of this candle right here. There were plenty of fake breakouts along the way, but once it came back to test that high, price reversed right there.
The sideways range broke to the downside, then we got a pullback-style move, and that's what brought us to where price sits now. Since price broke below the recent low, modified Dow theory now flips us into a downtrend. So just like I flagged at the start, right now our overall bias is firmly to the downside.
So for today's Trading Lab breakdown, since our bias flipped right here in the Tokyo session, keep in mind a downtrend is forming here, and if price later swings back and returns into an uptrend from this point, I'm also walking through the detailed scenario for spotting exactly when this correction ends, so you're ready and well positioned to catch the next leg up. Right now the bias is bearish, but if the bigger uptrend resumes, you don't want to miss it.
Let's read the reversal signals carefully and adjust our approach. That wraps up today's gold analysis session, everyone.