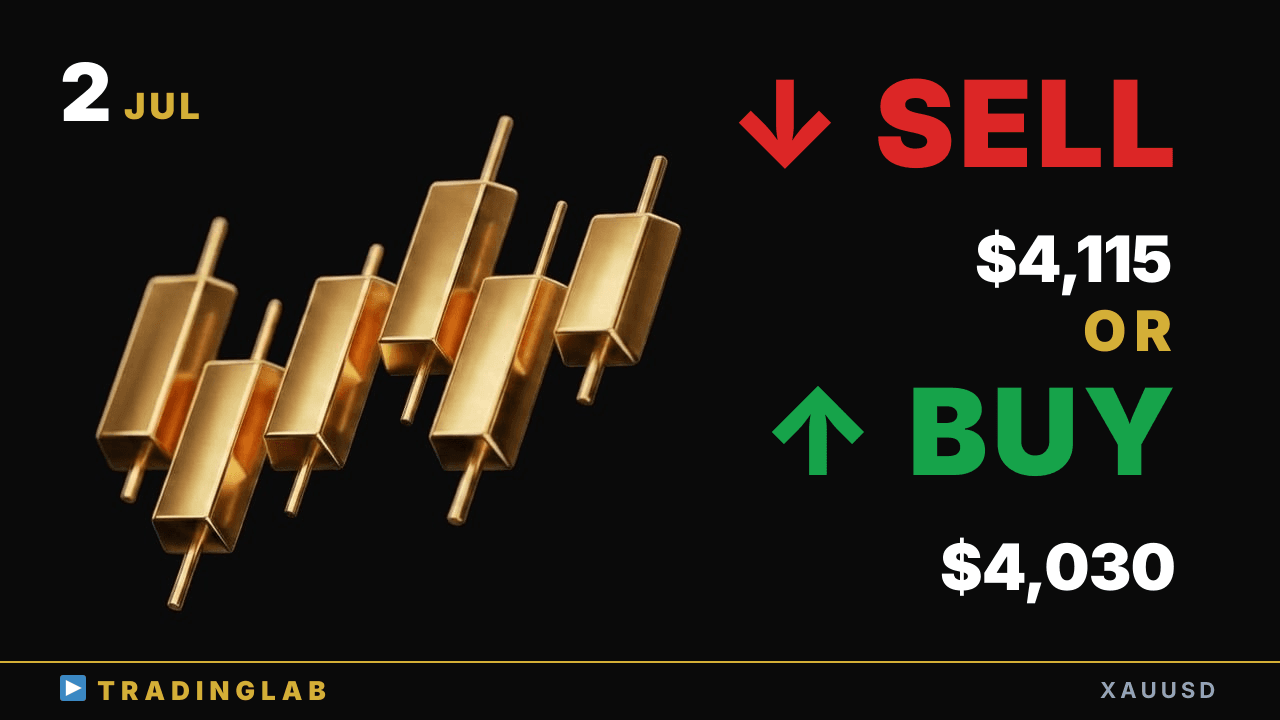
Gold broke out but is now coiling into a wedge near 4,079 — Daniel maps the correction risk. Watch 4,030 support and 3,960 below; 4,115 is the upside line if bulls hold. Bias stays up long-term, but is a sharp pullback coming first? Here's what to watch next.
Gold at 4,079 wedge — pullback to 4,030 or push to 4,115? | XAUUSD Jul 2
 Watch on YouTube ↗
Key levels in this analysis
| Resistance | 4,115 · 4,079 |
|---|---|
| Support | 4,030 · 3,960 |
Summary
Video transcript
Hey, this is Daniel, a working prop trader. Gold's big picture today Bias stays up, but short-term watch for a sharp corrective pullback. Yesterday as expected, it broke out above the sideways range into the NY session heading into the open it rallied about 1097 pips, and just recently we're seeing price action that looks like it's forming a wedge here For now the correction looks set to continue, so let me quickly walk through the overall direction Anyway, as always, let me start with the daily chart breakdown Gold's daily candle closed as a large bearish doji right at that level The
prior candle was a doji, and as I mentioned back yesterday at that doji's upper edge a sell bias kicks in, and at the lower edge a buy bias so that's the setup I'm describing, right around this cooling-off level So right now, honestly, it's a pretty tough spot to think about trading We talked about that earlier, and let's see how yesterday closed Looking at how it closed, the price got pulled back inside that doji's magnet zone That magnet effect
dragged the candle body back in, but if we zoom in closer on this closer look, both the lows and the highs closed by stepping progressively higher So my bias here is to the upside, though I said the exact same thing yesterday Since we haven't cleanly broken out yet, I'm building trades near support That situation where we just can't break through hasn't really changed since yesterday We've left a big doji here, so looking at how the day's trading
flow is shaping up As expected, the prior day's high and low are being watched as the range's upper and lower bounds This is a fairly easy setup to read, with clear reference lines like these As key levels go, the prior day's high and low are the ones traders watch most closely And now that they line up together, awareness of these levels is even sharper So this is the situation to keep in mind, and now let's break it down step by step I'll share
part of yesterday's community breakdown here on YouTube too So first, the very first thing I was watching was right here That sideways range here — once this doji candle got confirmed, it kicked in. The reference for this sideways range is set, but first The current market environment takes its direction from this breakout move I explained that price tends to consolidate here, and why that is Since it's a coin flip, I focused on the breakout The move afterward clearly decides the direction here What matters most here is the price action leading right into that point First it forms a clear reversal candle here, then a lower high We can draw the
line like this, a downtrend line So the picture here is that price broke out above this downtrend line to the upside After that setup, this range along the trendline kept holding, so in this kind of situation reversals down here tend to draw strong attention, especially with the same angle line If I extend it and draw the channel line, this recent reversal here The candle shows the bearish wave has lost the momentum to test the channel's lower bound
You can clearly see that now if you look, and moreover it goes even further Look closely and it's testing this recent big level too On the 4H or daily chart, it kind of forms a double bottom here Anyway, that reading is fine, but the real reason doesn't matter much The reason bulls keep consistently pushing longs here is this overlap, which becomes the benchmark for the next direction So this doji became one key axis in the setup here, and beyond
that What I was really watching was the candle at this specific point, so let me explain what it meant I'd explained deciding direction by the breakout side, right then I mentioned this with the doji, but it applies beyond doji candles too In a sideways range, doji candles work the exact same way here Since it's a range, inside these sideways ranges you get breakouts and pullbacks I was explaining that you can wait for the pullback and then enter
the trade Today's Thursday, and Wednesday's scenario was leaning to the downside I mentioned that a breakout of a candle like this one could set it up So if there's a pullback move, you could take that entry too. I walked you through how to trade this sideways range setup. After that breakdown, let's see how yesterday's market played out.
What happened here is that price broke out to the upside, clearing this doji candle. The breakout candle is nearly a full-body bull bar. It closed on that action, showing strong bullish momentum here.
So it's set up to keep pushing higher, but this breakout still needs confirmation, and now the direction really looks locked in with this whole move. The structure of this bullish swing and how price behaves during pullback phases I'm breaking that down in detail for the community today, and right now this uptrend I'm seeing a wedge-like shape here, so a range adjustment I said stay cautious here, and in 27 minutes this 1H candle closes By the close, if it's bearish, it's already formed a fairly large body If this breaks lower and enters a correction, we need to see which levels it targets Whether
it drops to that point first, then bounces back and rallies from there If it swings back toward trend, what we watch to decide today I'll break it down for our community members As I said up front, gold's bigger picture stays bullish, but short-term I'm watching for a wide-range pullback. That's it for today.