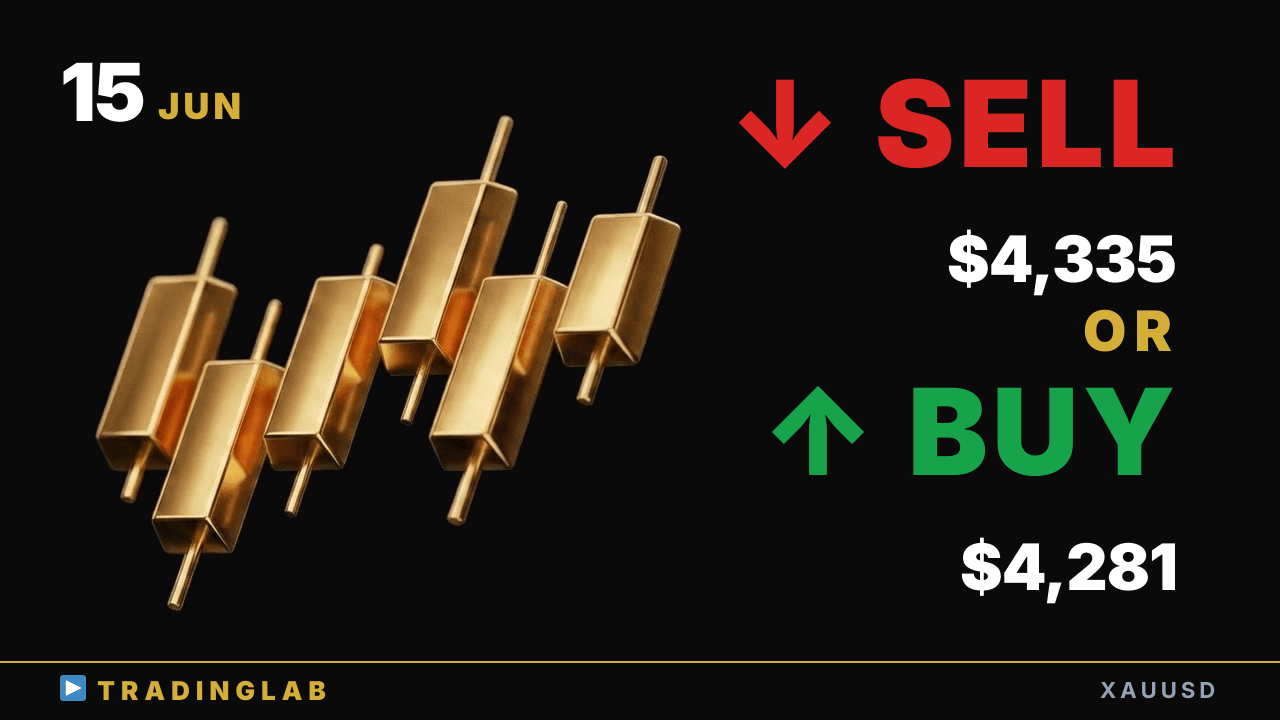
Gold has surged ~$165 from the swing low, with bulls firmly in control heading into June 15. Daniel breaks down the key levels to watch: 4,281–4,246 support below and 4,335–4,349 resistance above. Does the uptrend push to new highs, or is a pullback cooling setup forming first? Watch for the reaction at resistance to define your next long entry.
Gold at Resistance — Does the $165 Bullish Move Extend or Pull Back? | XAUUSD Jun 15
 Watch on YouTube ↗
Key levels in this analysis
| Resistance | 4,349 · 4,335 |
|---|---|
| Support | 4,281 · 4,246 |
Summary
Video transcript
Hi, I'm Daniel, an 8-year veteran prop trader helping beginners learn to profit consistently in FX markets. I run the Trading Lab community — check the video description below for full details. Today we're covering gold technical analysis.
I'll share some insights from inside the Trading Lab as well. Right now we have the 1-hour chart up, and as always we'll start with the short-term outlook first. As of right now, my bias is bullish.
Today's Trading Lab stream goes live at the London session open. At that point I was already calling a bullish bias, and most recently we saw an upward breakout of that doji candle, followed by a pullback before price pushed to new highs. The information has been updated accordingly, so our bias remains bullish, just as before, and we continue to hold that view.
Starting with the Tokyo session breakdown — gold ended last week with a final daily candle confirming as a doji, a key signal to watch closely. On the daily chart, the downtrend remains intact — and right near the high of the prior candle, we can clearly see selling pressure stepping in at that key resistance level. That said, since we're still inside a downtrend, selling pressure near the highs is completely expected — but what I really want to highlight here is the lower wick on that candle.
The candle formed a long lower wick, essentially creating a doji — and despite this being a Friday, we clearly saw buying interest step in at the lows. What's more, bulls were actively entering above the 50% level of the prior key candle, confirming strong bullish momentum in the market structure. This week also opened with a bullish gap from the session open, confirming that bulls remain firmly in control of the current market structure.
After this price action process plays out, if we see a pullback test of the cooling level, that becomes an active long entry opportunity worth targeting. At the cooling level, conditions have now shifted in favor of taking long positions with solid confidence. Now let's drop down to the one-hour chart, and I'd like to share part of what was covered in the Trading Lab members-only stream.
The detailed breakdown is exclusive content available only to Trading Lab members. Please keep that in mind. Now let me cover today's seven key points.
First, on the one-hour chart, current conditions are not yet decisive enough to confirm direction. We are in a difficult situation. The last Trading Lab stream was around this point on the chart.
After one strong bullish momentum swing has completed, we are now pausing briefly. After the bounce, price pulled back down again, making it hard to determine direction since a further drop was still possible at that point. Regarding the hourly timeframe, I had mentioned that an uptrend was forming.
I had mentioned that an uptrend was forming, because price had broken out above the high of that particular candle to the upside. That candle right there was the key turning point where the trend switched from bearish to bullish, and that is what I had been pointing out to you. However, you do need to be careful about the most recent swing low — specifically, watch these two candles right here closely.
After the first swing low here, we get a second test — and that second low actually closed slightly below the previous swing low, confirming a new lower low on the chart. So from a structural standpoint, we can say the trend has technically shifted to a downtrend, and this is precisely why I mentioned at the start that determining direction is genuinely difficult here. One key factor feeding into this overall picture.
When making your trading decisions, it is essential to clearly define the exact price level where you would switch your bias. For very short-term moves, you can also read the current bias as leaning slightly bearish. Scalp shorting is technically possible, but it demands advanced skill, so I don't recommend it for beginners.
More important than shorting here is recognizing the bullish momentum returning within this uptrend. Whether you can read the price action and confidently switch your bias to go long. These were the key points from Friday's price action.
Looking back at recent market structure, starting from the sell signal formation and the sideways move that followed. The double range formation, then the breakout above that range to the upside, leading into the second swing of the uptrend — covering the full sequence up to that point. That was the full breakdown I shared in the previous video — now let's see how the market actually played out after that analysis.
Focusing on last week's close, at the London session open we saw a strong bullish price action — lows updated and the recent high cleanly broken with a nearly full-bodied candle. With bullish price action confirmed, a long entry was valid right at that signal — and after it triggered, lows continued to step higher heading into this week. The opening gap up connected directly into a new recent high, confirming the scenario played out exactly as planned — now let's also check the price range covered.
From the setup's low to the most recent high, that move measured roughly 165 dollars, which converts to approximately 1652 pips total. This represents a strong bullish move, and that upward trend appears to still be firmly in place right now. Today's Trading Lab content covers what I just mentioned — we'll be broadcasting to Trading Lab members at the London session open later today.
Price has moved up in line with our bias, so now let's look at how far it could extend and how we should position ourselves. I've shared a specific strategy for your reference. For today, we continue to hold a bullish bias on gold. That wraps up today's gold market analysis. Thanks for watching.