Hi, I'm Daniel, an active prop trader. For gold today, I'm watching for a short-term rebound, but my main bias is still to the downside. Since the last video, the downtrend has continued exactly as in our scenario.
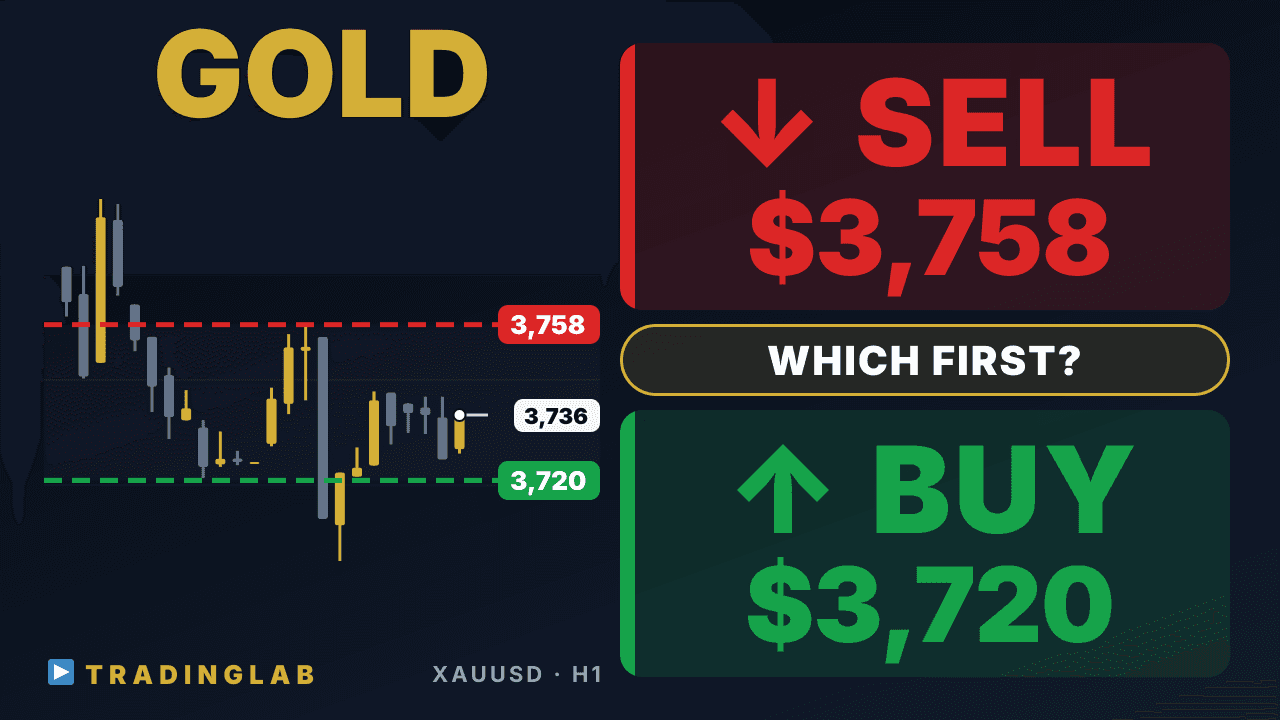
From the high at the time of that broadcast down to the recent low, gold dropped 104 dollars, roughly 1044 pips. Right now, after the recent big bearish candle, a bullish reversal candle has formed and price is bouncing. As for this small sideways range, the timing for a breakout is getting close.
In my view, the direction of this breakout will set the short-term trend. Will this rebound keep pushing gold higher, or will price quickly fall back into the downtrend? That's the key point I focused on in today's analysis.
Alright then, as usual, let's start with a detailed look at gold's daily chart. Looking at yesterday's candle, number 49, on the daily chart, it formed a large bearish candle. Because of this, on the daily chart, price has broken out to the downside of the sideways range that was built using these two candles, 46 and 47, as the reference candles.
So on the daily chart, we still have a downtrend with quite strong downside momentum, and from here, short entries off a pullback are basically easy to consider at the daily level. As for my daily chart bias, nothing has changed from before. I'm basically still bearish, and I'll stay bearish until a clear bullish reversal candle forms on the daily.
Also, yesterday's daily candle is a measured move you can read straight off this sideways trading range that just broke out. Price has now fallen exactly the full width of the range. At this point, the short-term picture has shifted to one where a bounce is likely.
And right now, the daily chart also confirms a rebound, with a fairly long lower wick. Now, earlier I mentioned that to switch our bias, specifically to flip to a bullish outlook, we need a clear bullish reversal candle to form on the chart. So what price action are we actually looking for?
Take today's daily candle. First, it absolutely has to close as a bullish candle. And second, it's important that the close sits fairly close to the day's high.
Or alternatively, if there's basically no gap between the close and the high, giving us a so-called bullish marubozu, I think today's daily candle is very likely to work as a strong bullish reversal candle. This isn't simply about judging that candlestick on its own. When you trace the whole series of bearish swings, bar 49 has a relatively large body, clearly bigger than bars 48 and 47, so I see a high chance it turns out to be what we call a climax bar in this move.
On the other hand, if the bearish view continues, many of you are probably wondering how far it could drop. Price has already reached the measured move projected from the recent short-term sideways range, so next we'll look at a measured move based on a bigger price swing. One useful reference here is the price swing from bar 43 to bar 45.
If you zoom out on the chart and look at this whole series of downswings, that move was the small initial downswing, so from the high at bar 46, I think there's a high chance price drops by a similar amount, mirroring that first leg. So on the daily chart, a price drop of about this size is a realistic target to expect here. Alright, next let's move on and take a look at the 1H chart.
Yesterday, the members-only stream for our Trading Lab community went out around this red line, when the sixth 1H candle closed toward the end of the Tokyo session. So what technical analysis and scenarios did I walk through at that point? Here on YouTube, I'll focus on just the key points and keep the discussion going from there.
The first key point is my directional bias. At that time, I was completely bearish on gold. Yesterday, price broke out to the downside from this trading range that had held for a long time, and during the Tokyo session gold showed a clear, textbook downtrend day.
And since the downside follow-through kept going, I said I was now completely bearish on gold. So basically, I told you I wanted to look at short setups and give priority to short entries. So what exactly do I look for when planning a short entry?
Here too, I've shared the specific price action setups in Trading Lab. The first one is a bullish reversal candle that fails. For example, on a day with a strong downtrend like this one, you can sometimes see a bullish reversal candle form in exactly this kind of shape.
A long lower wick, then the next candle makes a higher high, closing bullish. Naturally, stop loss orders from long positions tend to pile up just below lows like these. And since traders often enter in the direction of the trend, you could place a sell stop order below lows like these and enter a short position.
A downside breakout from a small sideways range follows the same logic. In a strong trending market like this, even if a small sideways range forms, it's failing to form a bullish reversal bar, so we'd want to enter on a downside breakout. Or a short-term pullback.
I was explaining you can also enter by watching candles like these. It's a very classic way to set up an entry, I think, but these are exactly the kinds of setups I really value and rely on. And of course, we also need to plan for a possible switch to a bullish bias.
And I think it's important to have clear criteria here. Specifically, a second test of the lows, the so-called double bottom pattern, or a sideways range, then a pullback after an upside breakout, clear higher lows, and whether follow-through continues. I said you should only consider switching to a bullish bias after confirming these signals.
And as always, inside our Trading Lab community, I really put a lot of effort into breaking down the key price action in full detail. To share just a few of the key points with you here, last time I walked through the price action right before this range breakout. We'd been stuck in a very long trading range, but heading into the New York session close, we could clearly see volatility contracting on the chart, and when volatility contracts like this, the next day's open, or the open of the following session, very often turns into a strong, directional trend day move.
So you really don't want to miss patterns like this. And the key point here is that after the upside breakout from the bear flag, there was no follow-through at all. So price formed a gently sloping bear flag like this on the chart, and the downtrend kept going steadily, but there was a move that broke out above the top of this bear flag, but there was no follow-through after that, so naturally the bulls were forced to hit their stop loss, and I was watching points like this.
If there's no breakout to the upside, that means price failed to clear the major trendline, so fading a small breakout like this could also have been a good spot to set up a short entry, I think. I also talked about how price action differs between trend days and trading range days. In our Trading Lab community, I explained that a trend isn't just about higher highs and higher lows.
You can also judge a trend from price action at key points like these on the chart. Today, let me walk you through the chart and check whether gold actually played out according to the trading scenario I shared with you in my previous analysis. As for gold after my analysis went out, as you can see, the downtrend continued exactly as my scenario predicted.
From the high of candle 6, which was already confirmed when my analysis went out, down to the most recent low, gold dropped 104 dollars, or 1044 pips, as the downtrend resumed in a very clear, easy-to-follow way and kept pushing steadily lower. It's dropped by a really wide margin. Today, inside our Trading Lab community, I've walked through the scenarios for what comes next, plus the technical analysis so far.
Here on YouTube, I'd like to narrow down what I'm explaining in today's gold analysis to three key points and walk you through them. First, the daily downtrend is still intact, so my basic bias stays bearish. Second, short-term price action is contracting, and the breakout direction of this small range sets the next short-term move.
Third, even if price rises, we reassess price action once again at important levels and stay alert for the downtrend resuming, The specific levels are covered in our Trading Lab community, but this reassessment means reassessing our directional bias. Even if gold does bounce after this and then pushes even higher by a much bigger price swing, it doesn't mean you should jump to calling an uptrend reversal. I've explained the specific criteria for judging that in detail in Trading Lab.
That wraps up today's gold market analysis for XAUUSD. Finally, a quick announcement. I run Trading Lab, an FX community helping even beginners profit from trading.
Right now, just by joining our Telegram community, anyone can watch our members-only lectures, up to lesson 5. Also, as a bonus for joining Trading Lab, I've just released a new video that packs my entire trading method into one system: the Daniel Trading Method. I've put it together so that complete beginners with no idea where to start can trade in a structured, logical way.
In Trading Lab, you get video lectures covering everything a beginner needs to start making money: technical analysis, how to build trades, and mindset, plus a Q&A room where you can ask me directly. If you've tried generic trading courses and signal videos but still haven't grown at all as a trader, check out the link in the description below. Let's keep growing together as traders. Thank you so much for watching today's gold analysis.