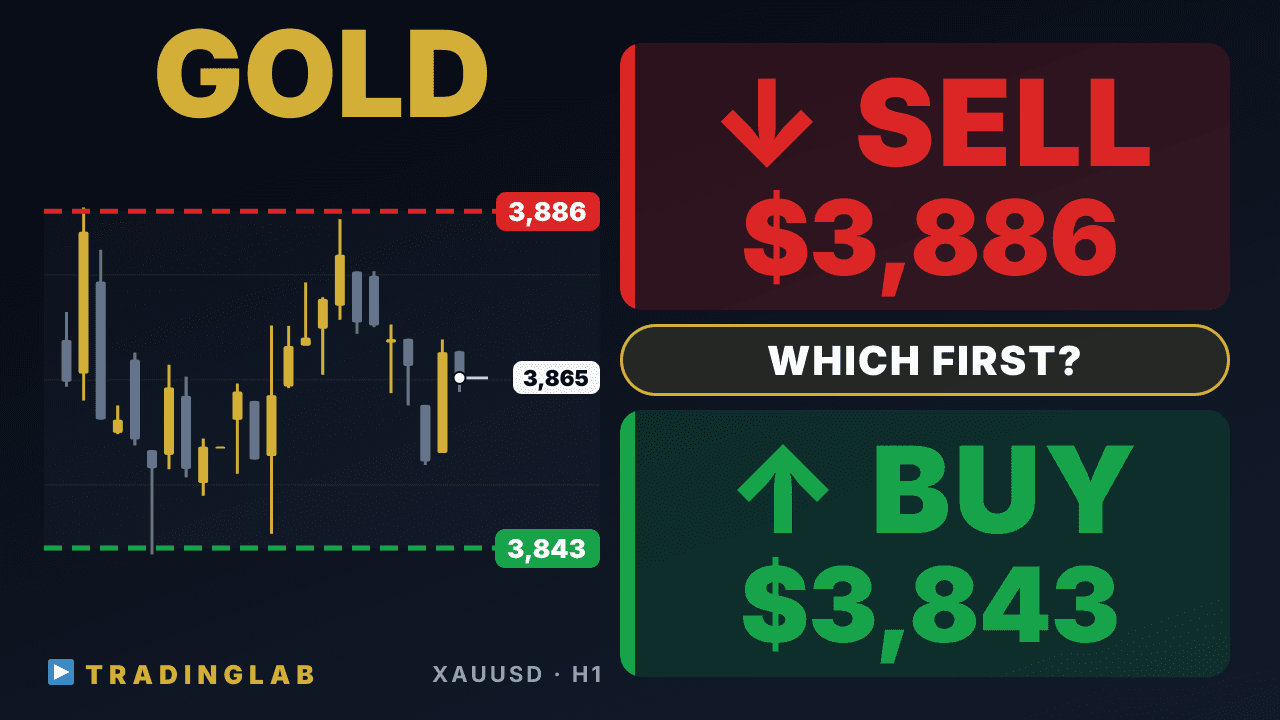
Hi everyone, Daniel here, an active prop trader. Today, my overall bias on gold leans more to the downside. Exactly as laid out in our scenario from the previous video, we saw a rebound of 41 dollars, or 411 pips, and then during the New York session we confirmed a drop of roughly 44 dollars, or 474 pips.
Right now the downtrend is still in place, but momentum is weak, so we're at a point where the market could shift sideways into a trading range. In today's analysis, I'll focus on whether this downtrend keeps going from here, or whether gold bottoms out, reverses, and turns back up into an uptrend. So let's jump right in and take a detailed look at the daily chart first.
Yesterday's daily candle closed as a bearish doji. It broke out below the bullish doji at candle 48, but even on the shorter timeframes we haven't seen any breakout and pullback price action confirming that move. Candle 49 itself ended as a doji, so at this point we can say the downside momentum was clearly weak.
So if you're looking to go short, the condition here is that we at least wait for some downside follow-through to develop first, rather than chasing yesterday's weak break lower. If the market stays in this range-bound mode with weak momentum, today's daily candle would likely close as an inside bar within candle 49. In that case, the expected scenario is a breakout in either direction during tomorrow's Tokyo session or London session, followed by a short-term trend forming with real momentum behind it.
Next, let's take a look at the 1H chart. Yesterday's live stream for Trading Lab members was here at this red line, around the time the first 1H candle formed at the London session open. Here on YouTube, I'll walk you through the key points of the technical analysis and scenarios I explained to Trading Lab members at that moment, so let's keep going.
First, the situation. Point one is the overall market context right now. As I mentioned before, the bigger picture still shows a downtrend continuing, so my bias here has been bearish.
However, look at the sixth candle of the Tokyo session, this candle right here. On this candle, price had already reached the measured move target projected from the previous day's trading range width. That was the setup.
So that's why my main message, first and foremost, was that even on the short-term timeframe, we needed to stay cautious about a possible price rebound. And then, if price did rebound from there and actually shifted into an uptrend, I explained that we'd judge that move through a breakout and a breakout pullback at two key levels: the daily low at 3867 dollars and the Tokyo session high at 3900 dollars. Rather than jumping in early, the plan was to let price confirm the reversal first.
On the other hand, when it came to short signals, I did want to actively look for short entries, but compared to the previous day, the selling momentum on the downside had clearly weakened. As you can see here, the market had shifted from a steady one-directional decline to a situation where the momentum was gradually fading, so I explained that it would be hard to capture as wide a move as we did the previous day. And as always, I also walked through the price action and the process that led up to this point, step by step.
The first thing I covered in that breakdown was the flow coming from the London session immediately before this move. Looking back at the London session at the end of last week, things kicked off right at the London open, and from that opening bell price went on to form a trading range. At the New York open we got a bearish doji candle, and that candle formed an outside bar against the Tokyo session's trading range.
So I pointed out that, from this very first opening candle, the New York session was also likely to move into a trading range, And sure enough, the New York session did go on to form a trading range after that. From there, we could confirm a breakout from the Tokyo session's trading range, then a pullback, and finally the measured move target being reached. Today's Tokyo session, or rather yesterday's Tokyo session, tested a breakout of this trading range right from the open, but it failed and formed a bearish reversal bar.
A fairly strong follow-through bar came next, then a doji printed at the range low, and it went sideways into a short-term trading range. On bar 6 it broke out to the downside, and that's where things stood at the time of the stream. At that point it had formed a bullish reversal bar, but it hadn't broken above the high yet, so there was no upside follow-through confirmed.
That meant the short-term bias was flat, though a bounce was likely. And since the bigger-picture downtrend was still intact, we treated it strictly as a bounce, with shorts worth considering afterward. Still, given the momentum so far, we couldn't expect a very big move from it.
That was yesterday's scenario and the key point of the technical analysis. So, how did gold actually move in the end? Just as our scenario expected, it saw a short-term bounce, and even after the livestream it climbed roughly 41 dollars, or about 411 pips, from the low that was in place at the time of the broadcast.
As expected, that turned into a lower high, and from the second hour after the New York session open, gold started to sell off steadily, dropping 44 dollars, or about 474 pips, all the way down to the most recent low. Overall, we got a rebound, then a drop with little range to expect, so it played out exactly in line with our scenario. In today's Trading Lab members-only stream, I covered the scenario and technical analysis using these 3 points.
The first point: a gentle downtrend continues, so my basic bias is bearish. The second point: the recent breakout to the upside failed, so watch for the decline to resume. The third point: if price rises again, reassess the direction at the key level.
In our Trading Lab community, we cover that key level with concrete examples and a detailed explanation. Trading Lab members, please check today's update for the full breakdown. Most recently, the downtrend has continued, though with weak momentum.
It could easily slip into a range now. I'll wait for price to reach the key level, read the price action closely, then consider an entry. That wraps up today's gold analysis.