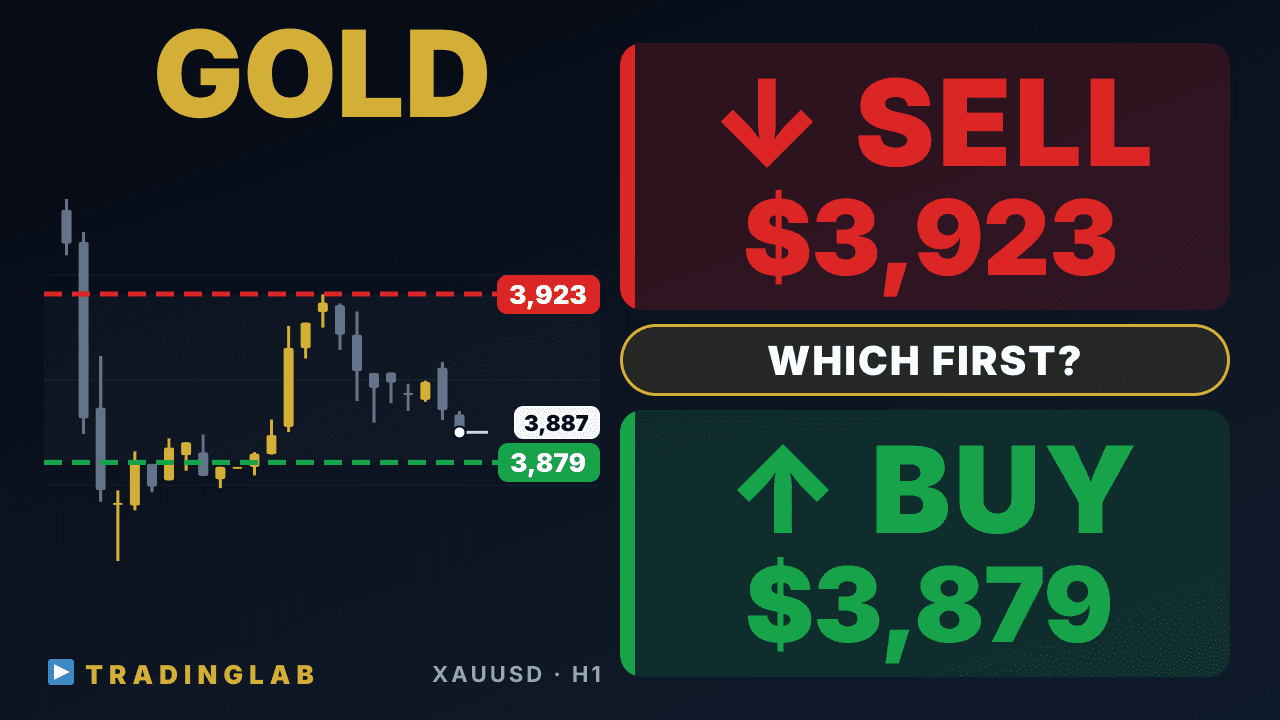
Gold just dropped $130 and is now stalling in a tight range under 3,923. I break down the daily climax candle, the 3,879 line, and the 4,000-3,968 range that set up the move. Two clear paths into today: a bounce that holds, or a downside break that resumes the trend. Watch where each scenario invalidates before you act.
Gold at 3,923 or 3,879 first? Today's two scenarios | XAUUSD Nov 13
 Watch on YouTube ↗
Key levels in this analysis
| Resistance | 4,000 · 3,923 |
|---|---|
| Support | 3,879 · 3,852 |
Summary
Video transcript
Hi, I'm Daniel, an active prop trader. Today on gold, I'm watching out for a short-term rebound, but the bigger picture is still a bearish outlook. Since last time, as planned, gold broke out below the Tokyo session trading range, and heading into the New York session open, We've already confirmed a sharp drop of $130, or 1301 pips.
Right now, price is rebounding off that strong downtrend, and in the short term it's forming a sideways trading range, but on the daily chart, a climax is still possible, so today I expect volatility to contract and price to settle into a trading range. So will price keep bouncing and turn back up, or will it finish this correction and resume the downtrend sometime today? That's the key question I focused on in today's analysis.
So let's dive right in and take a detailed look at the daily chart for gold first. Alright, here's the daily chart for gold now. Yesterday's daily candle closed as a big bearish candle, a strong one.
Right here, this is yesterday's daily candle on the chart. Originally the daily chart was in a setup where downside follow-through was likely. The follow-through to the downside that started from bar 47 here, counting yesterday, is now the third Consecutive bearish candle.
Also, the body of yesterday's daily bar 49 is larger than bar 48, and it's one of the biggest in this whole downswing, so there's still a possibility it turns out to be a climactic bar, a sort of selling climax. If today's daily candle makes a higher low and closes as a bullish candle, I think a bounce on the daily chart becomes more likely. If that happens, and the New York session really commits and bounces with strong conviction, then from the open of next week's Tokyo session I want to watch price action around these timings even more carefully than usual and judge it properly.
Also, if the candle ends up closing as a small doji, I personally see it as a candle where a breakout to the upside or the downside is equally likely to happen. So, look above the highs on both sides, and below each of the lows. We always need to be ready with entry setups for a breakout in both directions, and I personally think that's one important point to keep in mind here as a caution.
On the other hand, price could keep going and break out below yesterday's daily low. With momentum this strong so far, that's a possibility too. So if that happens, how should we approach it?
Personally, I'd first wait to confirm a breakout below yesterday's daily low. Then, if we also see a pullback back toward that level, I'd consider a short-term short entry from there. So, the scenario that offers the most profit potential for us today would likely be a move where price breaks out to the downside below yesterday's daily low.
Next, let's look at the 1H chart. The red line part shows the 1H chart at the time I did yesterday's stream for Trading Lab members. So what technical analysis and scenarios was I explaining at that point?
Here on YouTube, I'll narrow it down to a few key points and walk you through them. The first key point is that price was still moving inside the Tokyo session trading range, so I was basically treating that area, from 4,000 dollars down to around 3,968 dollars, as a sideways range. With a range like this, the basic idea is to follow whichever way price breaks out of these key levels.
But keep in mind, the underlying environment here is still a downtrend. The structure of this downtrend hasn't broken down, so I basically see this sideways trading range as a time-based correction rather than a reversal, which is why I think I answered my bias was still to the downside. And as for what comes next, if the London session sees the trading range continue or expand, I'm expecting the downtrend to resume from the New York session open.
On the other hand, if price clearly breaks above the Tokyo session high, meaning yesterday's Tokyo session high around this area, and we then confirm a breakout and pullback, then we'd switch to a bullish bias and look at setting up long entries, and I also explained, with clear criteria, exactly where that bias shift would happen. And as always, I also walked through the important price action that's played out since my last stream. So what kind of price action was I actually breaking down?
It's this one right here. This was on the 11th, so we're looking at the price movement in the London session on the 11th, from the sixth candle onward on the chart. So in the London session too, right after price bounced, it climbed with fairly weak momentum and formed a swing high.
Now, if we look at how price moved after that point, Price formed a doji here, then built a small sideways range, and the failed breakout to the upside triggered the reversal. I think this played out exactly in line with that day's scenario. It broke out while printing a doji, then pulled back, and on bar 5 it tagged that same price once more as a second test, followed by a downside follow-through doji, but Likewise, it kept making lower highs and broke out to the downside, so I'd say this one was relatively easy to read.
Then we got follow-through. Even on the latest big move, it broke out to the downside and the follow-through kept going. The bullish reversal bar that actually worked was the one from that day, the very first candle at the Tokyo session open.
It's shaped like what you'd call an IOI pattern, but its high actually broke above the opening candle's high, so I'd say a high like this, set within the first two hours after the open, often ends up being the high for the whole day. This is relevant here too. A sideways trading range had formed, using these two candles as the reference candles, and I think that became one key criterion when we were expecting a downside breakout.
In short, my bias was fully bearish, and I'd been explaining that we should stay alert for a downside range breakout. So how did gold actually move after that point? It played out exactly according to my scenario.
Around the Tokyo session close into the London open, a breakout occurred, and a doji candle formed as the breakout pullback. Even with just that one doji candle, considering the really strong downward momentum of the whole move that broke out below the doji, the entry was fairly easy to judge. Then, exactly as planned, at the London open price clearly broke out below the Tokyo session trading range, and heading into the New York open, it dropped a full 130 dollars, that's 1301 pips, a really big decline.
It played out exactly as our scenario predicted. Now, let me also share today's content for Trading Lab members: in today's report, I broke down the technical analysis scenario around these three key points. First, the big picture is a downtrend, so we stay bearish.
That's very clear. Second, the short-term bounce could just be a corrective phase. Considering the trend, and looking at how strong the bulls are right now, the bounce is likely to stay corrective.
As for whether a trend reversal comes after that, I've laid out the specific criteria in Trading Lab. And the last point: today, it looks quite likely that gold forms a range for the day. I'd focus closely on how price reacts at both the upper and lower edges of that range, since this could turn into classic trading range price action. That wraps up today's gold market analysis.