Gold broke its range and ran ~$199, and the daily chart has flipped into an uptrend — but price has hit its measured move and overshot the bull channel. The one thing to check: a clean daily breakout candle above 4,070, which opens the path toward 4,500. Lose yesterday's candle and the correction scenario takes over — plus the 1H range and $74 measured move plan.
Gold's bullish case hinges on one daily close above 4,070 | XAUUSD Nov 5
 Watch on YouTube ↗
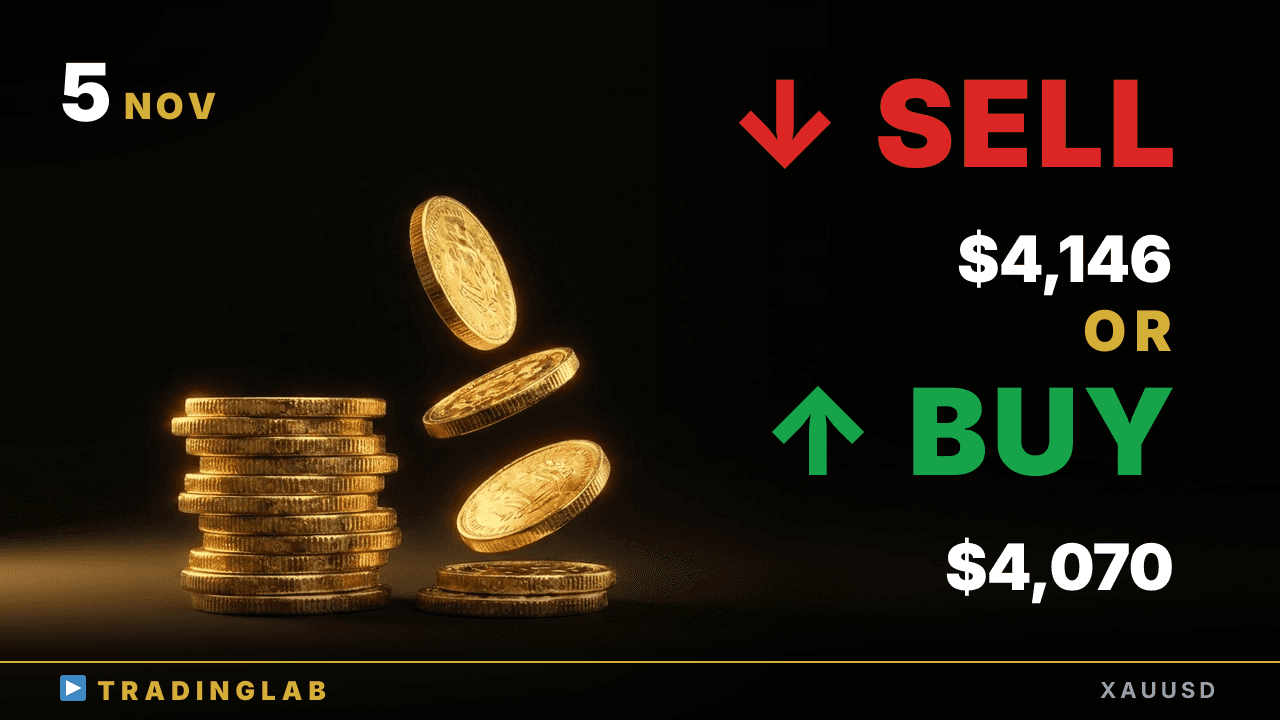
Key levels in this analysis
| Resistance | 4,146 |
|---|---|
| Support | 4,070 |
Summary
Video transcript
Hi, I'm Daniel, an active professional prop trader. Today my bias on gold is bullish. Since our last analysis, price broke out above the trading range, then formed a clean uptrend while carving out only shallow pullbacks along the way, rallying roughly 199 dollars, or a full 1997 pips, which was a strong move to the upside.
Right now, even the daily chart is clearly signaling a shift into an uptrend. In the short term, though, price has reached its measured move target and overshot the recent bull channel, so I want to stay alert for a correction phase where some of that strong rally gets unwound. In this analysis, I've focused on whether gold keeps extending its uptrend from here, or whether it first shifts into a price-based correction that tests the previous daily candle's high.
Alright, let's jump straight in with a detailed look at the gold daily chart. Looking closely at yesterday's gold daily candle, it closed firmly as a big bullish candle. It broke out to the upside above the recent bearish doji, so the large bearish candle at bar 46, the one I'd originally been worried about, is now realistically looking like it could have acted as a kind of selling climax, marking the bottom of that drop.
Today's focus on the daily chart is very simple. Unless price completely wipes out bar 49, effectively erasing yesterday's daily candle, we basically keep our bullish bias in place. On the other hand, for the bullish scenario, the focus is really easy to see.
It all comes down to whether price can push above the 4070 dollar level and clearly print a solid daily breakout candle there. That's what I think it hinges on. The reason is this.
If we look back at the daily chart, everything up to this point formed a downward spike, and after that, price kept steadily moving within a channel trend, continuing that structure. It's a well-known market theory among traders that price often comes back to test the starting point of a channel, and when that happens, a breakout of the channel will naturally occur. And the focus for this channel breakout is 4070 dollars.
For today, if price breaks out above 4070 dollars to the upside, that would lead to a clean move breaking out of the current channel. After that, if momentum stays strong, the uptrend could comfortably aim for 4500 dollars as a maximum target. So the long, drawn-out correction we've seen in gold over the longer term may now finally be coming to an end.
Next, let's move on and take a look at the 1H chart for gold. On the 1H chart, this red line marks where I did yesterday's Trading Lab members-only stream. I went live right around where that bullish doji formed, on the second 1H candle after the Tokyo session opened.
Here on YouTube, I'll keep going and walk you through the key points of the technical analysis and trading scenarios I was explaining exclusively to our Trading Lab community members at that moment, narrowing it down to what mattered most. So the first key point is this: from candle number 4 in the New York session on the 2nd through candle number 3 in the London session on the 3rd, price was moving sideways and forming a clear trading range on the chart, and since price was still trading inside that range, I explained in my analysis that on the 1H timeframe there wasn't any clear directional bias yet for us to follow.
And the previous day's rally does look, at first glance, like a double bottom formed by two strong bullish reversal candles on the chart, but since the follow-through to the upside afterward was quite weak, basically, my call was that the trading range would continue, and that's where things stood.
And then, with the second candle of the Tokyo session being a bullish doji, I was thinking the uptrend had failed to take shape there, Right here, you can see the first 1H candle after the Tokyo session opened marked the low, it formed a bearish doji, and I expected some downside follow-through, but then the next candle printed a bullish doji instead, so looking at that price action alone, the odds strongly favored a trading range forming here.
Going forward, take candles 1 and 2 at the Tokyo session open, a trading range using those two candles as our reference candles, and I think there's a high chance that this range will actually form here, Also, in the case where the upward follow-through after the breakout turned out to be quite weak, I was considering the formation of a so-called three push up pattern as one possible scenario.
Also, regarding the basic way to handle a trading range, I've once again posted extra notes in our Trading Lab community on how to approach breakouts, Basically, after a trading range breakout, the rule is to enter on the breakout pullback, Also, at this point the measured move projects $74 both to the upside and to the downside, and the full width of the final trading range at breakout, and I explained we should prioritize this as the measured move target.
And in cases where the candlestick at the breakout turned out to be small, I've explained in detail that you should consider placing entries in both directions, at both the range high and the range low. A way of trading that factors in so-called failed breakouts in advance, is something I explained as a practical trading skill. I've also added extra commentary on the price action since the last video.
Looking back at the price action since the last video, a double top formed right here, and price then sold off, and exactly the full measured move of this double top, and since it had already been hit on the very first candle of the London open, so my scenario at that point was to stay cautious of a possible rebound. And overall, I explained the scenario that it would end in a trading range, And that played out just as planned.
Right at the overshoot, price formed a bullish reversal candle, and then Heading into the New York open, it tested the range high, reversed again from the range high and formed a bullish reversal candle, and then showed somewhat weak upside follow-through, and that's where things stood going into the Tokyo session open and the time of this broadcast. But in the end, here's how gold actually ended up moving: Price broke out above the trading range, and that happened already in the Tokyo session.
Also, I'd said we'd wait for a breakout pullback to enter, In practice, the real breakout pullback isn't to the top of this bigger-picture candle 2, but rather it's a breakout pullback to the bearish doji of candle 4 that formed afterward, so After that it's a shallow pullback, with a time correction along the way, so the uptrend is still continuing. Measuring the range from this bullish candle's low up to the recent high, we can see price has rallied a full $199, which works out to a strong move of 1997 pips higher.
Momentum's very strong, so even if price has reached the target high for now, I'd basically stay alert for a second test of that high, and if there's a good signal for a trend-following trade, I think it's a phase where we'd want to consider an entry regardless of the bias at that point. In today's exclusive stream for Trading Lab members, I cover these three key points in detail. First, the strong uptrend continues, so I'm still bullish.
Second, after this rally, watch for a short-term drop or deep correction. Third, until a clear reversal shows, I explained we should prioritize setting up long trades to the upside. As things stand now, we're about two hours before the London session opens.
In the Tokyo session, bar 6 formed as a candle breaking out below the recent doji. After that, even from this bullish reversal candle, we just didn't get follow-through, So in the latest move, just as per our scenario, a correction is underway. And that wraps up today's gold market analysis, everyone.