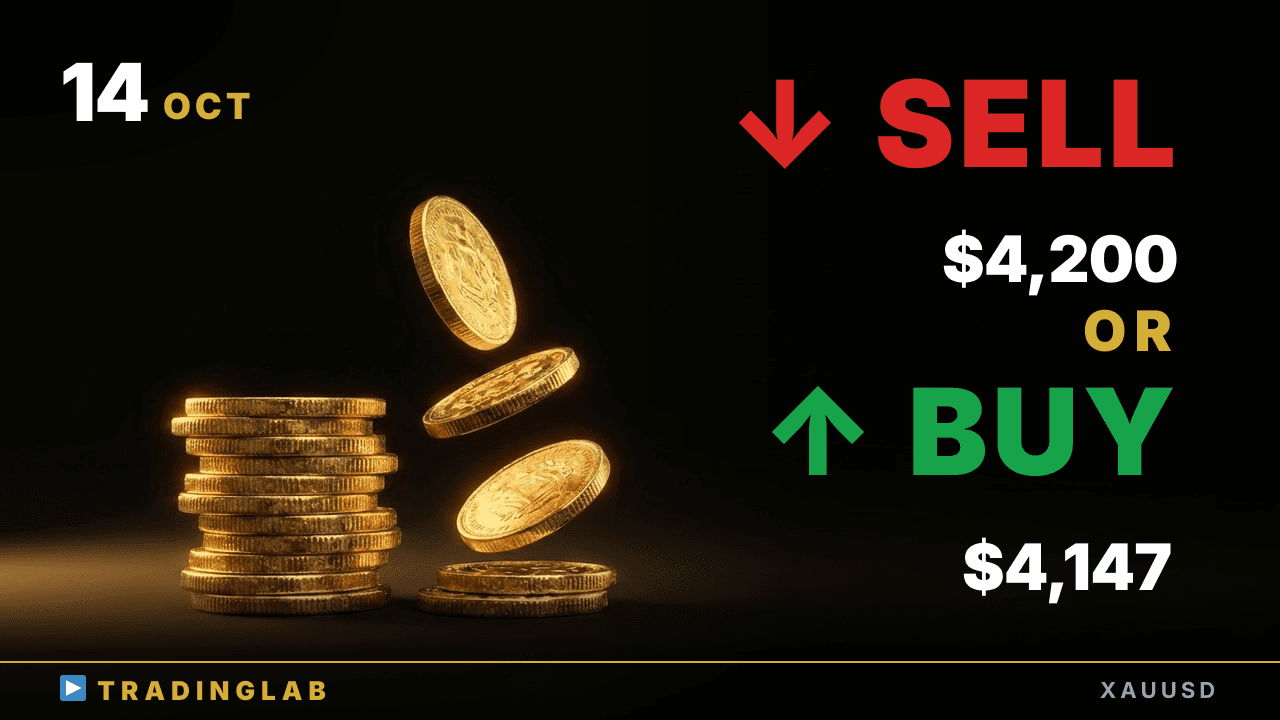
Gold closed the daily as a bearish doji after a 468-pip drop, and a bull flag is now building on the 1H. I break down the doji breakout that would turn this into an upside reversal — and what sends price toward 4,120 instead. Daily range levels, yesterday's high/low for counter-trend entries, and the 4,147 / 4,200 zones I'm tracking next.
Bull flag on gold: the one break that flips the bias | XAUUSD Oct 14
 Watch on YouTube ↗
Key levels in this analysis
| Resistance | 4,200 · 4,170 |
|---|---|
| Support | 4,147 · 4,144 |
Summary
Video transcript
Hi everyone, I'm Daniel, a currently active prop trader. Today on gold, my bias leans more toward the upside. Since last time, price broke below the doji candle we had been closely watching, which flipped our view bearish, and after that it dropped roughly 468 pips down into the most recent low.
Right now, after that drop, we can also see a pattern that looks like a bull flag forming. If price breaks out above the most recent doji candle, that's a spot where I'd want to target a reversal to the upside on the 1H timeframe. So the key question is whether price breaks higher from here and turns into a rally, or breaks out to the downside and falls toward roughly 4120 dollars as a guide.
That's what I focused on in this breakdown. Let's get right into a detailed look at the daily chart. Since our last broadcast, the daily candle has finished as a doji, but specifically a bearish doji, closing just below its open.
For the daily chart scenario, what I told you last time was this: the previous candle was a doji, but since it had clearly closed as a bearish candle, I said the daily trading range was likely to keep shifting lower step by step in the sessions ahead, with lower highs and lows, Also, at the time of that broadcast, even though price had broken out below the previous candle's low, it didn't develop into any real increase in bearish momentum and instead just left a long lower wick behind.
So I said that, first of all, a sideways trading range using that prior doji as the reference candle was likely to continue for the time being. On the other hand, I also pointed out the opposite scenario: a breakout from the daily chart's trading range could actually begin with a breakout of this doji itself. So I said you couldn't simply assume that this range would neatly and methodically come back down to test its lower boundary and bounce.
That said, for how to actually trade that day, I explained that a breakout on the daily chart is something you only need to think about once the daily candle has actually broken out, rather than guessing in advance. So first, using the previous doji as the reference candle, the idea I laid out was to take advantage of the sideways trading range that tends to form from it, on day-trading and shorter timeframes. In the end, yesterday's daily candle closed as a bearish doji, and its real body also pulled back toward the previous doji, so we can clearly confirm what's often called a magnet effect.
So first of all, on the daily chart, the sideways trading range has continued, exactly as our scenario expected. So for today, I think the sideways range is likely to continue, viewed as a wide band from the high of that doji one candle earlier all the way down to yesterday's low. On top of that, yesterday's high and low tend to work well as levels for counter-trend entries.
Keeping both of those points in mind, I judge that this is a situation where we should trade on day-trading timeframes or shorter. Next, let's move on to the 1H chart. On this 1H chart, the section where you can see this red vertical line marks where the 1H chart was at the moment I did yesterday's live stream exclusively for our Trading Lab community members.
Here on YouTube, I'll narrow it down to the key points and walk you through what I was explaining at that stage, so let's keep going. First, looking at the previous day, the Tokyo session showed what you'd call a clear, easy-to-read uptrend day. Then, in the hour just before the London session open, price printed a bearish doji candle for the very first time, and that's the situation we were in.
So, since that was a doji candle, the basic idea I shared was that the 1H chart tends to pick a direction based on whichever way price breaks out of the doji. On top of that, the preceding trend was a strong uptrend, and the candles had left relatively large bodies, so based on past theory, I explained that an upside breakout was the more likely scenario rather than a downside break. If price did break above it, I noted that the width of the trading range at that point would tend to work as a measured move target afterward.
On the other hand, if this doji broke out to the downside, I explained that we would switch to a bearish view using that breakout as the signal. Likewise, on a downside breakout, the final width of that trading range would tend to work as a measured move target. As one important milestone, there was the level where the short positions from just before had most likely already hit their measured move target and taken profit.
I also mentioned that price could drop all the way down to that level as a possible downside target. So with that situation in mind, I'd like to walk through together the whole sequence of price action step by step, including exactly which technical analysis led me to reach these judgments and scenarios on the gold chart. First, as of the time of the stream, I think the part I hadn't explained yet was around here.
If we focus on the price action after this bearish doji candlestick formed, and look at the moves leading up to it, the market first extended its downside follow-through just as the scenario expected. I had said we should keep a flat bias for the New York session, but the Tokyo and London sessions had continued the downtrend, and in that context, the New York session really changed character, moving sideways and forming a flat range, so we ended up with a clear trading range structure.
We could see volatility contracting, which was a classic sign ahead of a range breakout. In the end price broke out to the downside of the range and tested the lows at the same level, then at the Tokyo session open it tested those lows again, printed a bullish doji candle, and reversed from there. After that reversal, price extended cleanly in one single upswing, and it kept steadily making higher highs all the way into the London session.
Then the London session opened, so I explained that the first thing to watch was which way price breaks out of this bearish doji candlestick. So, with that in mind, how did gold actually end up moving? After the live stream, price broke out to the downside of this bearish doji candlestick we had been watching closely, and from there it kept falling straight toward the 46 dollar area here, dropping roughly 468 pips in total.
So you can see that the breakout direction of this doji candlestick was the key signal we used to switch our bias. In today's stream for Trading Lab members, I walked through the next scenario using these three key points. First key point is the latest doji candlestick.
Whichever way price breaks out of it will set the next direction. Second key point, price has retested the recent lows, and right now it's leaning toward a slight upside reversal. Third, if the move to the upside fails, we'd be looking at a continuation of the downtrend, and I've covered the specific price action for that scenario inside our Trading Lab community.
On the 1H chart, the latest candle just closed as a bearish doji, so with 56 minutes left on this next candle, I'll be watching closely to see whether gold can stage a rebound from here. That's all for today's gold analysis.