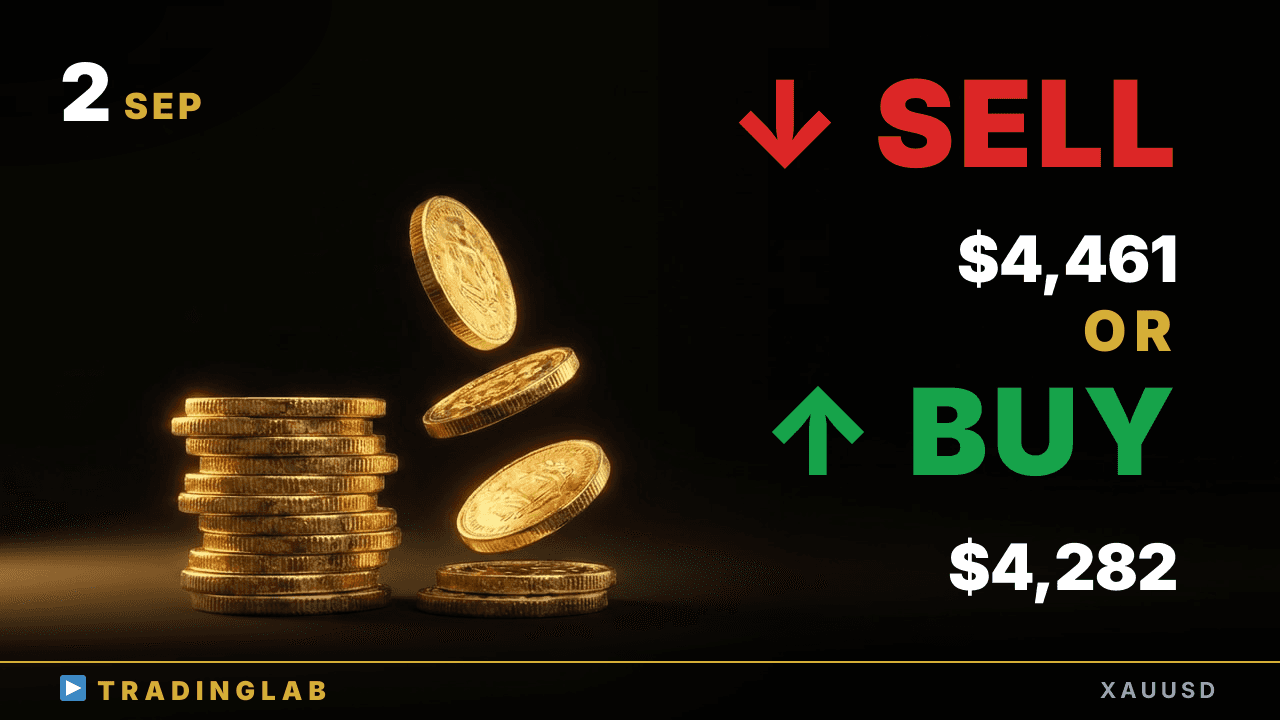
Gold sold off into the daily range low near 4,282 after a $145 drop, and momentum is still heavy. Daniel breaks down the daily doji range, the 4,334 measured-move target and 4,461 resistance. Rally selling stays the base plan — but watch the Tokyo session low for a reversal. Where to wait for a pullback instead of chasing the next break.
Gold at 4,282 range floor — reversal or slide to 4,334? | XAUUSD Sep 2
 Watch on YouTube ↗
Key levels in this analysis
| Resistance | 4,461 · 4,334 |
|---|---|
| Support | 4,282 |
Summary
Video transcript
Hey, this is Daniel, your prop trader. Gold is looking bearish today. Since last time we broke below the trading range, and just as I planned, price dropped to the daily target low.
Right after the broadcast, price slid all the way down to that recent low, roughly 1451 pips. Strong downside momentum is still very much in play, so the base plan stays rally selling, but watch closely for a reversal near that Tokyo session low. The big question today is whether this downtrend just keeps grinding lower, or whether that Tokyo session low sparks a reversal and flips us into a fresh uptrend.
So let's dive straight into the daily chart on gold. Yesterday's daily candle closed as a big bearish candle, a strong red bar down. The daily chart scenario I laid out for you last time looks roughly like this.
Looking at it quickly, candle 2 here formed a doji. Because this candle turned into a doji, I mentioned there's a high chance a sideways range based on the four price points — open, high, low, and close — gets built out from here on the daily chart. Next, there's the case where candle 2 breaks out to the upside.
In other words, if price breaks out above the high of this doji, then by the height of that doji's range, we'd be looking at an equivalent move projected upward from there. I mentioned there's a strong chance we'd see a pullback here. On the other hand, if price breaks out below this doji candle to the downside, then in that case, Since price is sitting inside this sideways range at a key level on the daily chart, I explained in the last video that, realistically, we'd most likely come down to test the lower boundary of the range and the area near the low of that big bearish candle.
As I mentioned earlier, the previous day closed as a big bearish candle, and right now price is breaking below that prior doji to the downside, so we're actively testing the low, pushing into that lower area of the range. Right now, at this daily-chart gray-zone level, the scenario we'd been expecting was a breakout above followed by a pullback, but instead price has fallen all the way back down and returned right inside the range. Now that we've come down and tested that lower boundary, on the daily chart the odds of a reversal here are basically pretty high.
But the downside momentum coming into this level has been really strong. I'd been leaning bullish based on that prior upswing and how powerful its momentum was, but looking at it now, this down-swing carries almost exactly the same momentum, so my bias has gone completely flat here. So if you set overly greedy take-profit levels, today's the kind of session that reverses on you easily.
That's why I'd keep the timeframe at day-trading or lower, and when it comes to breaking new highs or lows, for the follow-through move after that, I think the smarter play is to wait for a pullback first and then re-enter, rather than chasing it right away. Now let's move to the timeframe and look at the 1H chart. Yesterday, before the London session's opening candle closed, I put out a broadcast just for our community members.
What I covered there is exactly this. So here on YouTube, I'd like to walk you through those key points and explain what kind of scenarios I was laying out and what I was watching for. So here's the first point.
We're still trading inside the previous day's range, so range-bound trading is the basic assumption here. Reversal candles that form inside the range carry a low edge. This is something I say all the time: signals inside a range, especially around the middle zone, often just don't work.
So I really wouldn't put much weight on them. Better not to rely on them at all. Second point.
Even though I've drawn the trading range across this gray zone, the real effective floor is likely to sit lower, right here at the low of candle 4. That's the level I was flagging, the one that actually matters as support, so keep a close eye on that low rather than the range boundary itself. On to the third point.
What I was explaining here is that if price breaks out of this range to the downside, and you measure the range's measured move projection, then gold could drop sharply in one clean move all the way down to 4407 dollars. So that's the downside target you'll want to keep firmly on your radar if that breakout actually plays out. Let's also recap this whole sequence.
The day before, price broke out above candle 1 with candle 2, but then a bearish reversal candle killed that breakout, and from there the downswing kept running all the way down to candle 4. The highs were making lower highs, but the lows failed to make lower lows, so what we had was basically a range forming. Now if you look at each of the key levels, candle 4 here was effectively acting as the bottom of that range, and as a standalone setup it was actually quite strong.
So going forward, that level tends to work well as the range floor, and for the upper boundary, that's candle 3, the point where we got that clear bearish reversal candle. I explained that level would keep drawing attention going forward too. Basically this is a sideways range built inside a broader downtrend, so it's really just a time-based correction, a pause before the next move.
The odds favor an eventual downside breakout, but I made this clear at the time: if price breaks above candle 3, that bearish reversal candle, meaning it clears the Tokyo session high, then I'd flip my bias and switch over to looking to the upside instead. So how did gold actually play out? After the broadcast, price broke below this range to the downside, cleared the 1H target low — sorry, that's the 5H level — and kept dropping toward the daily target low, falling around 145 dollars, exactly 1451 pips, playing out precisely as the scenario laid out.
This first leg wrapped up right around the target low. At the New York session open we got a bit of a bounce, but price failed to make a higher high and then rolled over again, dropping hard for a second time. It ended up testing the low of candle 4 — the one I pointed out earlier on the daily chart breakdown — and it's now sitting right at exactly the same level as that low.
In today's community-only breakdown, I'm walking through both the bullish and bearish scenarios built around these three key points. First point: strong bearish momentum keeps my bias to the downside. Second point: I'll favor rally selling and watch reactions at key levels.
Third point: if a clear reversal pattern forms, I'll consider switching to a bullish bias. Inside our community I broke down in detail exactly which price points I'm watching and how I expect price to react there. Alright, let's jump back to the live real-time chart again.
Recently this small doji broke to the downside, pulled back, and dropped lower. With about 36 minutes left, the 1H candle isn't confirmed yet, but right now it looks like it's trying to stage a rebound here. Now the question is whether it swings back into the range, or keeps following through to the downside, so let's track this move closely. That wraps up today's gold update.