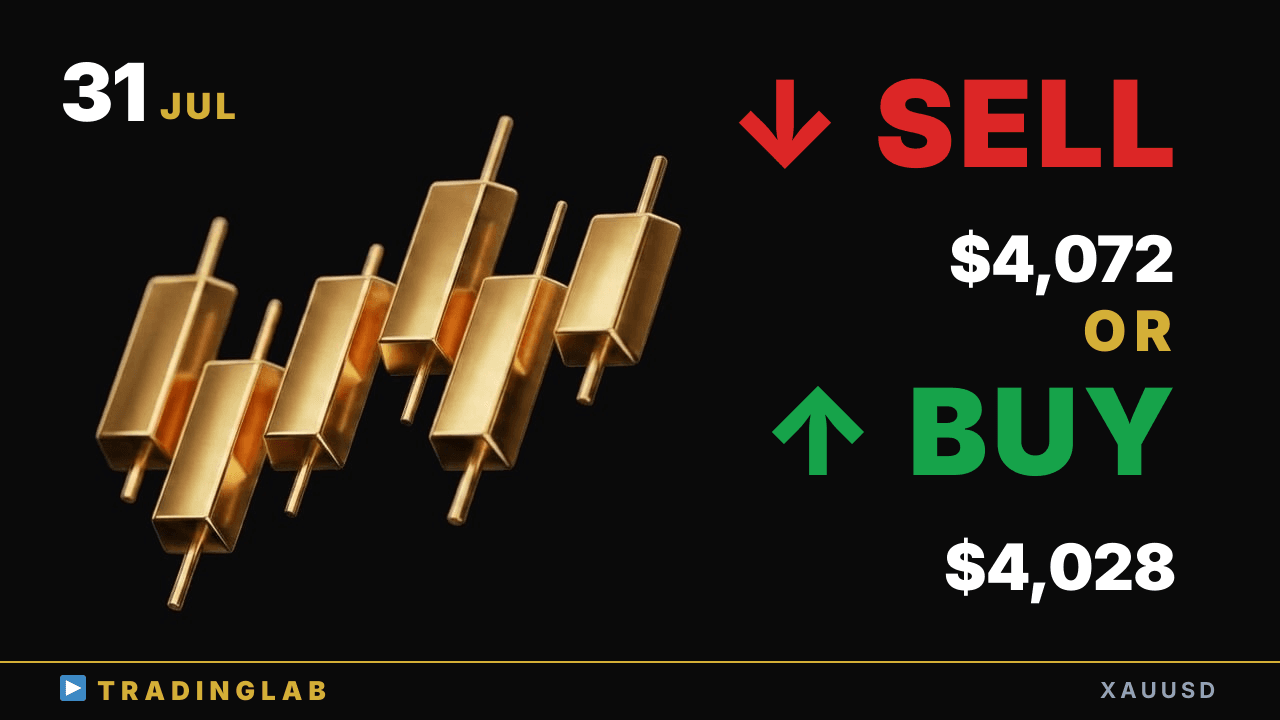
Gold broke below the 1H uptrend line and is pushing lower into a 4,028–4,072 range. Daniel breaks down the daily doji, the rally-selling setup, and the 4,107 level above. Plus the four signals that would confirm a real trend reversal — and where I'm watching next.
XAUUSD Jul 31: Broke uptrend line at 4,072 — breakdown to 4,028 or reclaim?
 Watch on YouTube ↗
Key levels in this analysis
| Resistance | 4,107 · 4,072 |
|---|---|
| Support | 4,028 |
Summary
Video transcript
Hi, I'm Daniel, an active prop trader. My bias on gold today is to the downside. On the 1H chart, price reversed and keeps falling, and it's now broken below the recent uptrend line to the downside as well.
So right now my main approach is rally selling. Last time, exactly as I laid out in our community, price rallied off this bullish doji candle here and the upside swing kept running from there. That's a move of roughly 836 pips into the New York session open.
Right now the daily chart is stuck in a sideways range, and yesterday's fourth candle stands out as a key level traders are likely watching closely here. Today I've walked you through whether this drop keeps going or flips back into an upside move, including exactly what conditions would confirm a real trend reversal. So let's dive straight in and break down the daily chart in detail.
Yesterday's daily candle on gold closed as a bullish doji, a small green body with equal opens and closes. Yesterday my main scenario for the daily chart was that the sideways range would continue, and that we'd revise which candle serves as the range's reference bar. Originally I was treating that bullish doji candle as the reference bar for the sideways range.
But since that bullish doji closed by engulfing the prior three days as an outside bar, I explained that we'd now use this candle as the new reference bar for tracking the range. As it turned out, the prior day's bullish doji candle also closed contained within this range, so on the daily chart we're still in that same sideways range, and it continues to hold for now. Since we're in a sideways range again, sell bias tends to dominate near the top of that range.
Backing up that sell-biased setup, price has pushed hard to the downside right from today's open, so momentum is clearly leaning lower. Right now, just like I said at the start, this doji hasn't broken out in either direction yet, so on the daily chart we're still stuck inside a range. That's an important factor to keep in mind and factor into your strategy as we drop down to the 1H chart next.
Alright, let's move down and take a look at the 1H chart now. In yesterday's community-only stream, I walked members through this red-line area right as that bullish pin bar formed. Let me share a portion of what I explained on YouTube, walking you through it point by point, so you can see exactly how I was reading this setup step by step.
What I was really watching was the breakout of this bullish doji, and whether price would swing straight back into the uptrend. It was a really strong bullish swing, the same shape drawn the previous day, and by the textbook a second upward swing had a high chance of forming from there. First we got a bullish doji, a pin bar with a long upper wick at this broadcast point, and it broke out to the upside.
But when a candle forms with that kind of long upper wick, on its own it's usually read as a signal that price is likely to reverse back down afterward. That said, my trading style isn't to judge what happens next off a single candle in isolation. So in this particular case, I explained to the community that this move most likely functions as a pullback against what's essentially a flat, sideways trading range here.
And this whole read comes directly from how price actually moved through the process. As I mentioned earlier, the upside swing was clearly strong in structure, and a second bullish swing was expected, and those two things were the core reason for favoring the long-side bias here. Of course the market can always move either way, so if the picture flips to a downside bias later on, the key signals would be this reversal candle and the doji forming right at that prior bullish candle.
I explained that connecting each of those swing lows gives us this rising trendline, and if price breaks below it to the downside, that's where we'd flip our bias over to the short side. So how did the market actually play out? That long upper-wick bullish pin bar ended up acting as our effective pullback, and after the session went live, price kept pushing higher with the upswing continuing.
Exactly as I flagged at the start, the scenario played out cleanly and into the New York session open we saw price rally by about 83 dollars, roughly 836 pips higher. And on today's move, price closed in a way that shows this trendline was one key pivot level, forming a bullish pin bar that retested it, and from there we're now seeing clean downside follow-through developing right off that retest. So for today's Trading Lab community session, I'm walking through how to spot a shift into an uptrend using four specific signals — the idea being that once you catch these clues on the chart, that's your read that a bullish reversal is developing here.
As I touched on a moment ago, I'm also explaining why you can't judge a signal candle on its own, and how price develops off a sideways range into either a clean breakout or a failed breakout — walking you through that whole process step by step. I've covered the four signs of a trend reversal several times in past updates, so if you've just joined the community, go back and review those earlier posts together, work through the examples, and really lock this in as a solid, repeatable skill you can lean on.
Gold is currently in a downside bias, so watch for those four reversal signs before flipping to an uptrend, and don't miss a single one. That wraps up today's update.