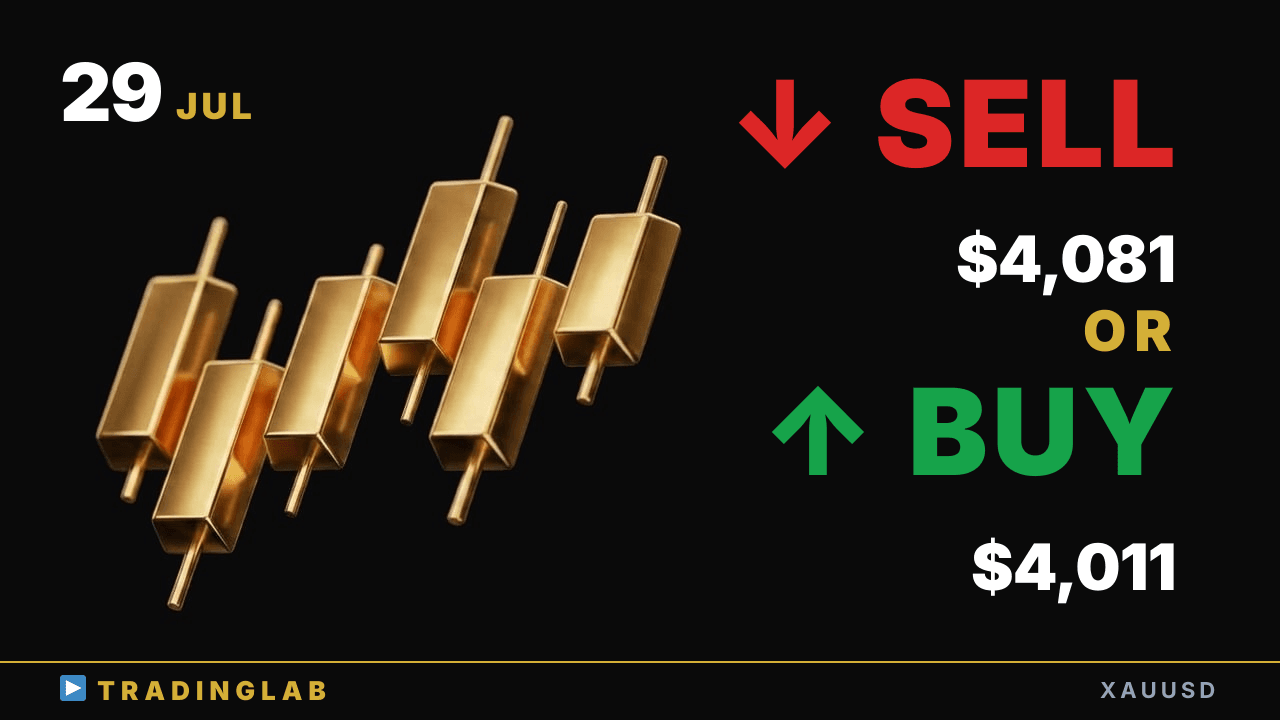
Gold is stalling at the bear channel top after a 434-pip drop — real decision point right now. Daniel maps both plays: the upside swing runs, or sellers step in on the rally back toward 4,011. Watch 4,044 as the pivot and 4,081 resistance, with the exact triggers to flip long or short.
XAUUSD at bear channel top: reclaim toward 4,081 or sellers drive back to 4,011? | Jul 29
 Watch on YouTube ↗
Key levels in this analysis
| Resistance | 4,081 · 4,044 |
|---|---|
| Support | 4,011 |
Summary
Video transcript
This is Daniel, a professional prop trader. On today's gold, looking at the current 1H chart, I'm biased to the upside here. After reversing off the lower bound of the revised bear channel, price has built a short-term upswing.
This upswing hasn't broken down yet, so for now I'm leaning toward a bullish bias here. That said, we've just reached the top of the bear channel, and on the 5-minute chart price has already broken below the most recent minor trendline right here. If a proper sell setup keeps forming from here, I'll flip my bias straight to the downside.
Last time, just like the scenario I shared in the community, the sideways range broke to the downside, and the internal structure formed with two clean bearish swings. We've now confirmed a drop of roughly 434 pips from the recent high. Right now we're sitting at a real decision point: does this upside swing keep running, or do the sellers step in on the rally and drive it back down?
I broke down both long and short setups, including the exact triggers to flip between them. So let's jump right in and start by walking through the 1H and daily charts. Gold's daily candle from yesterday closed as a big bearish bar.
Within our main scenario, we're now seeing that pullback back to the doji on candle 4. From here, if that downside momentum holds, there's a second alternate scenario in play: a move down to test the low of candle 3 that I flagged yesterday becomes much more likely. Right now, on the daily chart, I'd say the more likely outcome is a sideways range forming with candle 4 here acting as the baseline candle.
One more thing: how the London and New York sessions play out from here becomes a key moment that decides the direction even on the daily chart. If I'm going to lay out the bullish scenario too, that would be the case where price reverses right here and swings back into an uptrend from this point. In that scenario, unless today's daily candle closes as a full bullish marubozu with no wicks, we basically stay inside this range on candle 4, so honestly the odds are pretty slim.
But if we do get that clean marubozu close on today's daily candle, then after that we could see a push aiming for the high of candle 5. Next, let's move down to the 1H chart. Yesterday's Trading Lab community stream ran right around this red line, where a bullish doji formed.
Here's exactly what we walked through in that session. Let me walk you through exactly how I broke down each of these key points on YouTube. First point: after the 9th candle, price built a sideways range, so I decided to wait and confirm the breakout direction before committing to a bias.
Candle 9 is right here. It looks like a lower-stage setup, but in context the downside momentum here is extremely strong. Price keeps retesting the same low, but the lows themselves are stepping down.
Given this setup, a sideways range was the most likely outcome to form here, which is exactly why I made this particular call. The second point: with a downtrend backdrop, my main scenario was a rally selling setup once the swing high formed. The downtrend had really strong momentum, so I judged that once a swing high formed, price would most likely keep falling from there.
That's the third point. I also walk you through the scenario based on candle 9, explaining the whole process and the price action that led me to settle on this particular scenario. Candles 1 through 4 run from right here all the way over to this candle.
Here we confirmed the pullback after the downside breakout of the trading range, so I'm expecting the downtrend to continue. As I mentioned back in the video before last, I've been keeping a close eye on this range. After the breakout, I flagged a pullback forming a lower swing high, which meant the downtrend was very likely to keep pushing lower from there.
From candle 5 onward — candle 5 is right here — I walked through how the direction could shift, factoring in a scenario where the trading range itself keeps stepping lower to form a stair-stepped, downward-drifting market structure. Next up is candle 9, and since it confirmed strong downward momentum, I judged that a real reversal here would demand additional, clearly bullish signals to back it up. On top of that, I figured candle 9 alone simply wasn't enough to confirm a genuine reversal here.
Next, on candle 10, I was factoring in the chance the sideways range breakout could fail, so I decided to hold off and wait for an even stronger reversal signal, like an overshoot of the bear channel. As it turned out, we got a solid reversal candle, and once the whole thing broke below the sideways range to the downside, we saw it drop about $43 from the high, which works out to roughly 434 pips in that move down. Now, on the 1H chart this is a bit hard to spot, but if you drop down to the lower timeframes, you can clearly see a second downswing forming here.
Now, how to think about that second downswing is something I've walked through many times inside the community, so I'll hold off on covering it here on YouTube. For today's community-only stream, I'll be walking through these three key points, including how I expect the move to unfold from here. The bear channel's upper boundary is the key decision point today — whether we reverse or break out — and right now I'm watching how this 1H candle closes.
The most recent candle just closed, and since it printed inside the channel, I think we'll likely form a sell setup right after this and make another push down to retest those lower levels once again. That wraps up today's gold analysis.