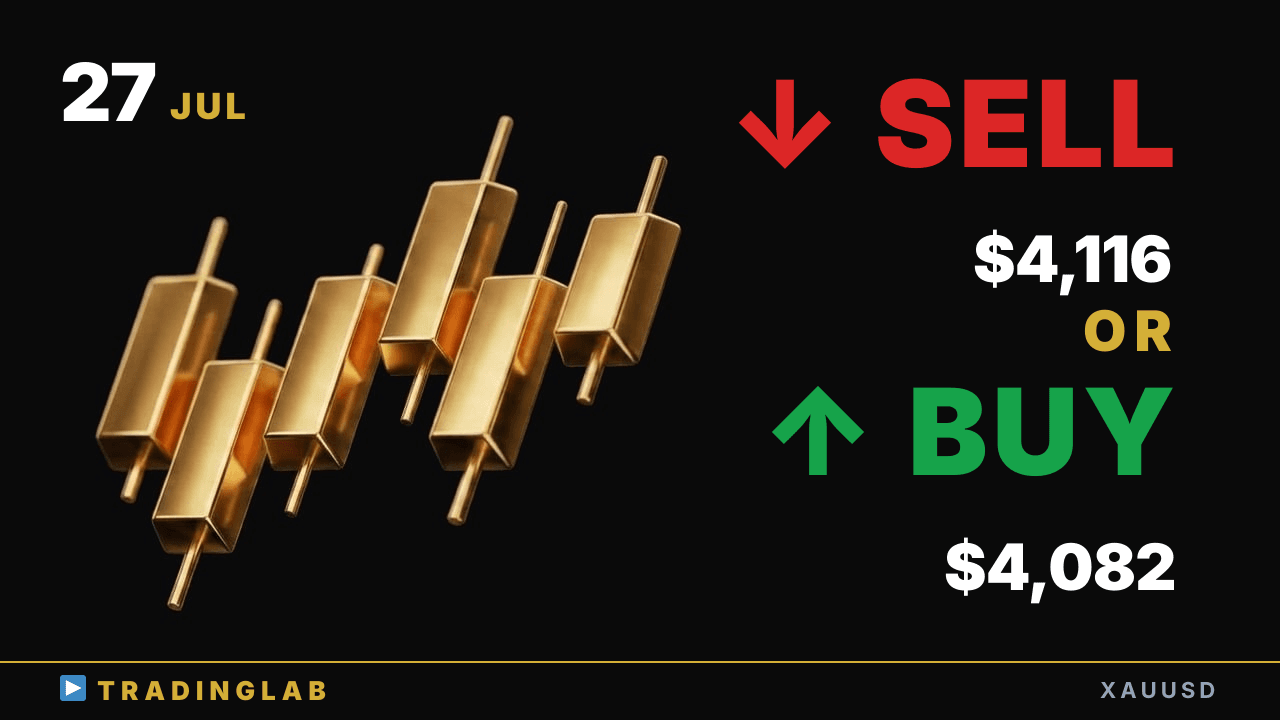
Gold is fighting inside the Tokyo session range with the bigger trend now flipped bullish. Daniel breaks down the D1 doji and the 4,116 resistance vs 4,082/4,084 support that decide the next move. Wait for the range break to confirm before planning longs — here's the setup to watch into tomorrow.
Gold in Tokyo range — breakout above 4,116 or fade to 4,082? | XAUUSD Jul 27
 Watch on YouTube ↗
Key levels in this analysis
| Resistance | 4,116 |
|---|---|
| Support | 4,084 · 4,082 |
Summary
Video transcript
Hey, Daniel here, a working prop trader. Gold is looking bullish today. But right now, price is still fighting inside the range built in the Tokyo session.
So don't rush into a trade here — wait to confirm which way price breaks first, then plan your entry. Last time, price broke out above the high of that candle we flagged in our community stream, After that, we got a pullback that tested that key level exactly, and price then rallied about 373 pips higher, playing out right in line with our scenario. Right now, as I said earlier, we're still fighting it out inside the range built during the Tokyo session.
The bigger-picture trend, after last week's move here, has now flipped into a clear uptrend. It's a bullish view, but the key question is what kind of breakout we should trust here. Refocusing here, I think we're now at the stage where we need to judge the breakout of the range built in the Tokyo session.
Today I walked you through everything from these key points to the actual trade setups. So let's dive right in with a detailed look at the daily chart. Gold closed last Friday's daily candle as a doji with long wicks on both sides.
In terms of my outlook, I'm working with two scenarios here. First, the bullish case: if we get a bullish candle forming from here, Even if it climbs from here, the upward momentum stays weak, so it grinds higher. So I'd like to ride this short-term uptrend and start looking at longs here.
As one key milestone for that rally, we should treat the high of this recent bullish candle as our upper limit here. If price does push higher, the upside momentum is likely to stay weak and fade quickly, as I explained. On the bearish side, meanwhile, the scenario I'd expect is price dropping to test this low here.
That particular move never actually played out, but in the end the bullish scenario turned out to be exactly right. It's forming a sideways range with weak momentum, and although it did open with a bullish gap right at the start. Right now, just as I mentioned at the start, it's still chopping around inside the Tokyo session range.
So on the daily chart there's no real change in my plan here — we just carry forward the exact scenario I laid out at the end of last week. Alright, let's dig into the 1H chart now. On the 1H chart, I ran a Trading Lab community stream late last week, right around where this bearish candle marked in red formed here.
Here on YouTube too, let me walk you back through what I covered there and lay out several of the key points for you. In the community-only stream, my focus was this bearish candle here — I used this big bearish candle as the one key reference for reading the market. This is the big bearish candle formed in last Friday's Tokyo session.
Whether we'd see a bullish wave strong enough to break out above this level to the upside was one thing to watch, and that was our main bullish scenario here. On the other hand, if price failed to break above this level with a bullish move, the downtrend would simply continue, and we could treat this doji-line transition here as nothing more than a sideways correction. So it was a relatively simple read.
That said, if price kept making fresh lows from here, it was very likely forming a falling wedge, and either way, as I explained, the downtrend had already moved into its final, late-stage phase where the move was close to running out. So, walking through the price action that led me to this call, inside the community we went back over the whole thing as usual, including the entire sequence of that downtrend move. The first thing I want to highlight is this breakout candle out of the sideways range from the London session.
That follow-through does continue afterward, but the very next candle forms a bearish pin bar, and then, even though it's still a bearish candle, we get one that pushes the high higher. At this point, a sideways range forms using those two candles as the base. So after this, on the downside, selling pressure naturally tends to kick in, but since this bullish candle is working right at the lower bound of the sideways range, I'd say our read on it was actually correct here.
But if you follow what happens next, that first key candle here, the second reference candle in this sideways range, actually closed as a bearish candle, and what's going on is this. Take this reversal candle formed at this awkward, in-between spot: if there were bulls placing a long stop-buy just above this high, then by this candle they're already sitting on an unrealized loss.
On the other side, we do see a step-up forming here, but afterward the bulls never really show any strength, and given how strong the recent downside momentum is and that we're inside a clear downtrend, this sideways range is much more likely to break out to the downside, which is what we'd expect And once it breaks out to the downside, you can clearly see how strong the bearish momentum was, and the next breakout candle prints a lower wick. This acts as the real pullback, and then follow-through kicks in on that first breakout candle.
Then we get two consecutive candles forming that first line of follow-through, and the next candle prints a strong, large-bodied move that then settles into a sideways range. This candle likely doesn't work as a climax bar, so there's a good chance price pushes lower and prints fresh lows after this. Now look at this bearish candle that printed right before I went live, and notice its position — it formed exactly as price reached the recent closing price zone we've been tracking.
After that, a bullish candle formed — a green one — though it failed to lift the low and make a higher low there. You could say the downside follow-through that should have kicked in here just didn't. Here's why: right at this stream's red-line bearish candle, price took out the low, yet no stop-sell orders got triggered in that price action.
And looking at the recent trend's volatility, there was still clear room to run down to the bear channel, yet price stalled out like this. Once price broke above that prior candle, this was the moment we could start thinking about flipping the bias to the upside, shifting into an uptrend and potentially resuming that larger bullish move once again from here. Watching that whole sequence unfold, I explained that if we spotted price action confirming real strength from the bulls here, we'd flip our bias to the upside.
So how did the market actually play out from there? After price broke out above the high of that big bearish candle, we then saw a clean pullback down to right around that key level. Counting from the low where that pullback formed, last weekend actually delivered a clean move higher, right in line with the scenario, a solid $37 range or 373 pips of upside.
It was a slightly tricky move, but given it was a Friday, I'd say price ended up tracking the scenario fairly cleanly overall. So in today's community session, I focused on this range built during the Tokyo session and the internal battle inside it, and I walked through exactly which kind of breakout I'm watching for next, laying out detailed bearish and bullish scenarios based on several possible setups. For today, this Tokyo session range still has us in a wait-and-see mode, but the bigger picture uptrend is clearly still intact and running. I'm still leaning bullish on the bigger picture. That wraps up today's stream.