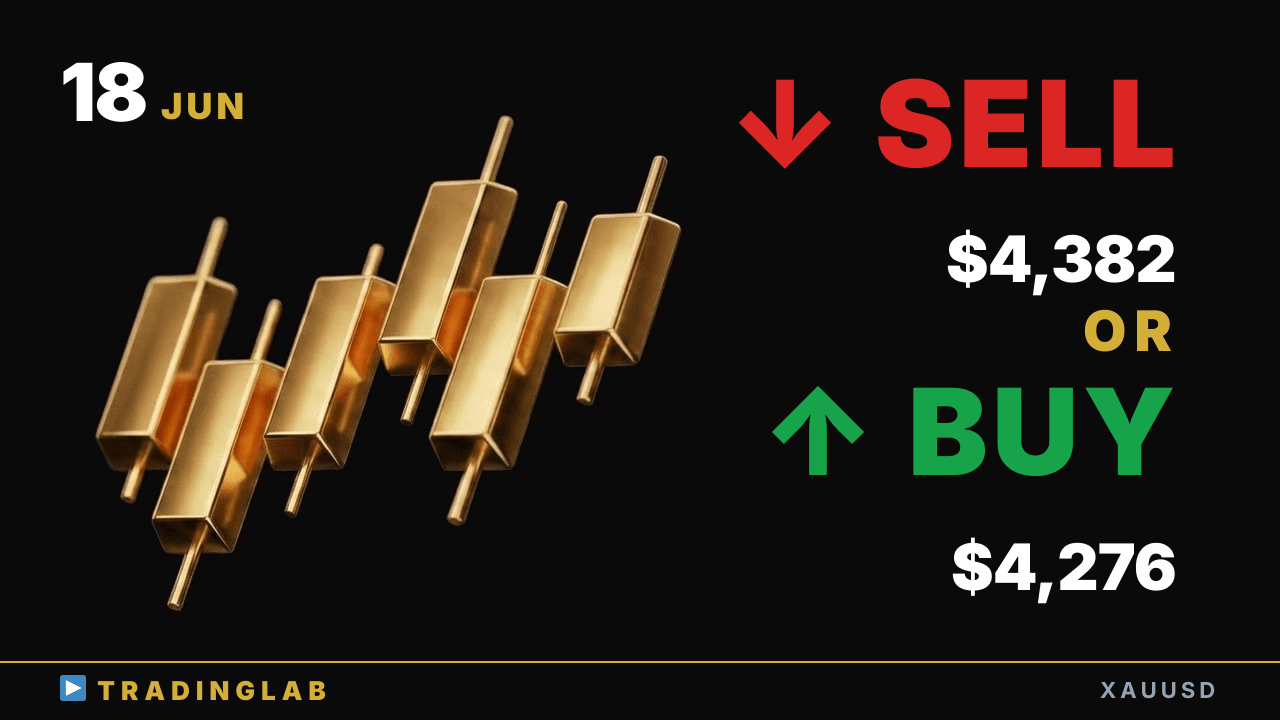
Gold printed a bearish doji signal on the daily chart, with price now consolidating in a low-liquidity range between support near 4,276 and resistance at 4,329–4,382. A breakout of the inside bar will define the next directional move — Daniel walks through exactly what to watch. Key question: does the bearish follow-through extend, or does price build a higher low for a bullish reversal attempt?
Gold at Doji Decision Point — Breakdown Extends or Reversal? | XAUUSD Jun 18
 Watch on YouTube ↗
Key levels in this analysis
| Resistance | 4,382 · 4,329 |
|---|---|
| Support | 4,276 · 4,219 |
Summary
Video transcript
I'm Daniel, an 8-year pro prop trader helping beginners master FX trading. I run the FX Trading Lab community for all traders. For more details, please check the description box below this video.
Today I'll cover gold technical analysis from Trading Lab I'll blend in some of that content as we walk through the current analysis. About an hour ago I shared this chart with Trading Lab. So right now Daniel is viewing this market with a bearish bias.
We can confirm a bearish candle has formed, signaling a downside breakout. Now for the short-term view, let me first answer the gold outlook question as usual, and then move into a detailed analysis of yesterday's gold market. a large bearish candle with a doji has formed on the daily chart.
First, as for the market movement up to this point, this pinbar acts like a doji candle. I had been explaining that it was acting in that role. It developed into a move breaking above the range ceiling first.
This breakout to the upside ultimately failed, so by the book testing that doji level was the natural expected move here the prior day's candle showed expanding volatility versus the previous bar the same candle then broke out downward through that level so theoretically this candle acts as a doji signal here so we can expect follow-through to the downside from here on the other hand, we should watch yesterday's indecision candle closely so overall
the chart is showing a sideways range structure, and today we remain in a cooling consolidation phase tracking the move from the open, the Tokyo session chased highs so this played out as a pullback move following that push higher so this pullback has become quite a deep retracement overall so calling this a confirmed downtrend based on price action alone feels premature so for now the market remains in a relatively thin, low liquidity range condition
a breakout of the inside bar will define the next market direction so determining the direction of gold will be the key factor to watch going forward after forming a clear buy setup recently, we saw strong bullish momentum has been driving price higher for a bullish trend reversal, a retest of this low will naturally be required whether price forms a higher low or holds near the same level we need to watch for that, and also take note of this doji
candle as a key pivot the horizontal range is forming again, and we should watch the short term price action inside it a bearish wave that discourages new short entries is needed clearly inside this range, a pullback is forming we need to see a wave take clear control of price action so in summary, we are waiting for a breakout of this doji candle the daily chart direction still needs to be decided from here Now let's move on and look at the one hour
chart analysis The day before, a Trading Lab exclusive stream covered this red line area The detailed breakdown from that stream is exclusive to Trading Lab members That content is exclusive to Trading Lab community members only. First, let me share my thoughts on the current market outlook and direction. Based on yesterday's price action, we can now see a triangle pattern forming.
I discussed the likelihood of consolidation forming. within that range, a false breakout was possible, but the trend would ultimately push higher the probability of a breakout to the upside was high I had mentioned this yesterday, based on the market conditions at that time. I'm now reviewing the recent price action and the subsequent rally from here.
This marks the end of the swing and the upward swing move. A classic price action setup was confirmed here. So I was walking you through exactly what this price move means for us.
This pattern appears often, so it's worth remembering well. And this circled point here is a perfect sell setup formation. This sell setup formation was signaling a downside breakout.
Once this was confirmed, connecting these two points shows us the structure. This gives us the classic triangle consolidation pattern forming. And here it's again forming a lower wick and bouncing right back up.
There are at least three recent touches confirming this as a key level. So connecting these points gives us the exact same trendline drawn here. So having tested that support level, price is now likely to push higher from here.
So price is in a favorable setup to push higher and attempt a reversal upward. This would confirm a second attempt at the reversal. Right before the stream, we formed an inside doji candle, then shifted into a sideways range.
Looking back at how price behaved after that, this sideways range held. The range broke upward, just as the triangle scenario predicted. We can confirm price has broken out and is pushing higher from here.
The low set during the London session is right at the range low. So this looks like a valid long entry point with a lower wick forming. From this low, reached around 2 AM Japan time last night, the high reached was about 65 dollars, just as the scenario predicted.
That works out to roughly 654 pips of upward movement in total, as expected. Today I'll also be covering some Trading Lab member content here. And today's outlook, as I mentioned at the start, the three-star pattern I had given a bearish outlook, and recently price broke above this doji Right after the stream, within the first hour, price hit the doji level. So price is forming exactly as expected, following today's scenario perfectly. That wraps up today's gold analysis.